

2018). Overall, due to rapid urbanization, high unemployment (over 7.3%), income
inequality and resource limitations poverty persists and thrives in urban SSA (Bluhm
et al. 2018). However, there is lack of accurate information and reliable data about
poverty in urban slums, which could compromise the efforts to develop efficient and
inclusive policies and interventions to reduce urban poverty (Lucci et al. 2018).
1.2.2 SDG 2: Zero Hunger
SSA registers some of the highest levels of under-nutrition, malnutrition and food
insecurity globally. Despite substantial progress reducing under-nutrition (decrease
from 30% to 22.9% between 2000 and 2016) the levels of child stunting and food
insecurity are both still highly variable between countries and unacceptably high
compared to other parts of the world (UNECA 2017). For example, more than a
quarter of the population is severely food insecure in each sub-region compared to
the global average of about 10%: Eastern Africa (32.2%), Central Africa (32.8%),
Southern Africa (24.8%) and Western Africa (25.8%) (SDG Centre for Africa 2019)
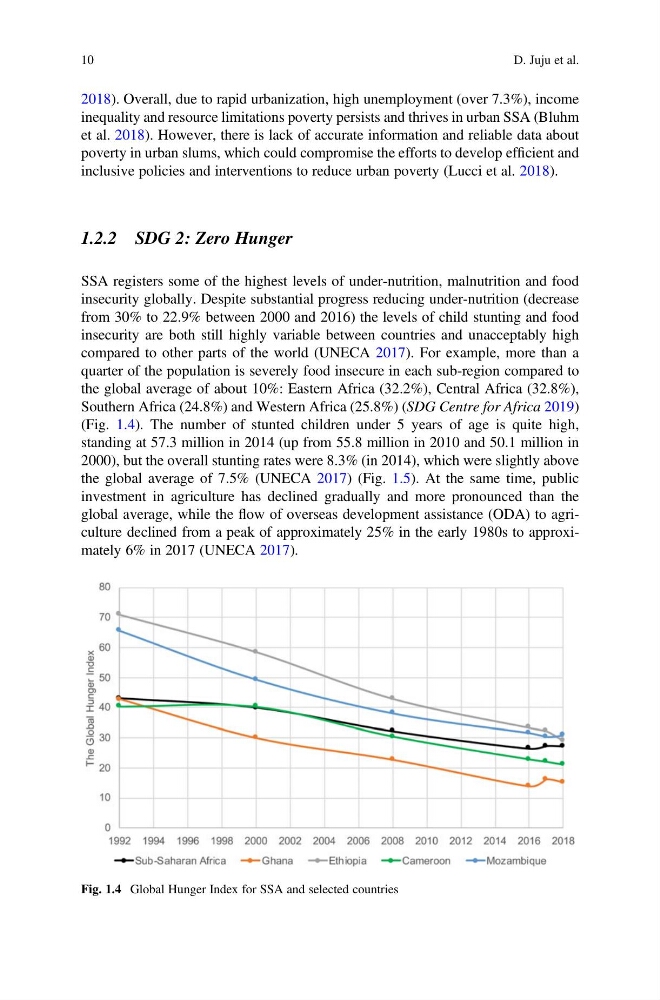
(Fig. 1.4). The number of stunted children under 5 years of age is quite high,
standing at 57.3 million in 2014 (up from 55.8 million in 2010 and 50.1 million in
2000), but the overall stunting rates were 8.3% (in 2014), which were slightly above
the global average of 7.5% (UNECA 2017) (Fig. 1.5). At the same time, public
investment in agriculture has declined gradually and more pronounced than the
global average, while the flow of overseas development assistance (ODA) to agriculture declined from a peak of approximately 25% in the early 1980s to approximately 6% in 2017 (UNECA 2017).
Fig. 1.4 Global Hunger Index for SSA and selected countries
10
D. Juju et al.
inequality and resource limitations poverty persists and thrives in urban SSA (Bluhm
et al. 2018). However, there is lack of accurate information and reliable data about
poverty in urban slums, which could compromise the efforts to develop efficient and
inclusive policies and interventions to reduce urban poverty (Lucci et al. 2018).
1.2.2 SDG 2: Zero Hunger
SSA registers some of the highest levels of under-nutrition, malnutrition and food
insecurity globally. Despite substantial progress reducing under-nutrition (decrease
from 30% to 22.9% between 2000 and 2016) the levels of child stunting and food
insecurity are both still highly variable between countries and unacceptably high
compared to other parts of the world (UNECA 2017). For example, more than a
quarter of the population is severely food insecure in each sub-region compared to
the global average of about 10%: Eastern Africa (32.2%), Central Africa (32.8%),
Southern Africa (24.8%) and Western Africa (25.8%) (SDG Centre for Africa 2019)
(Fig. 1.4). The number of stunted children under 5 years of age is quite high,
standing at 57.3 million in 2014 (up from 55.8 million in 2010 and 50.1 million in
2000), but the overall stunting rates were 8.3% (in 2014), which were slightly above
the global average of 7.5% (UNECA 2017) (Fig. 1.5). At the same time, public
investment in agriculture has declined gradually and more pronounced than the
global average, while the flow of overseas development assistance (ODA) to agriculture declined from a peak of approximately 25% in the early 1980s to approximately 6% in 2017 (UNECA 2017).
Fig. 1.4 Global Hunger Index for SSA and selected countries
10
D. Juju et al.