

to less than USD 5 billion per year. Preliminary findings suggest that SSA countries
free of external debt have experienced increases in total domestic revenue and public
investments (Cassimon et al. 2015).
While the overall assistance directed to Africa is roughly distributed proportionally among the sub-regions (Fig. 5.1), certain donor countries tend to prefer specific
regions to allocate ODA funds. This possibly reflects past colonial ties and present
social and economic interests (Zanger 2000). For example, the top five donor
countries
2 targeted mainly North and East Africa (Table 5.1). The United States
and the United Kingdom focus their ODA primarily on East Africa (44% and 50%,
respectively), while France focuses mainly on North Africa (43% of its total ODA).
Germany and Japan, on the other hand, split their ODA between North and East
Africa (52% and 70% of their total ODA respectively). Similarly, the top four
international agencies in terms of ODA
3 focus predominately on East and West
Africa (41% and 29%, respectively) (Table 5.1).
Figure 5.3a highlights the research priorities related to individual SDGs as
captured by Boafo et al. (2018). There is extensive literature for SDG5 (Gender
equality) (Chap. 1 Vol. 1; Chap. 4 Vol. 2), SDG13 (Climate action) (Chap. 1. Vol. 1;
Chaps. 2 and 3 Vol. 2), and SDG1 (No poverty) (Chap. 1 Vol. 1). This is evident in
Cluster 3 of Fig. 5.3a. However, the actual funding directed to those SDGs is
relatively low (Fig. 5.3b). As a matter of fact, these research priorities reflect some
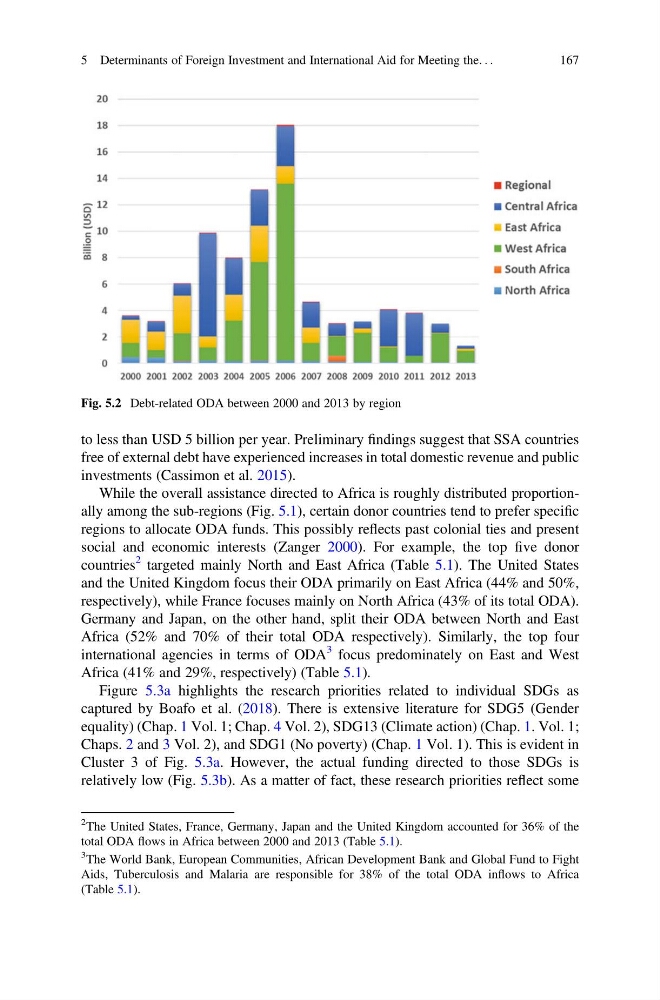
Fig. 5.2 Debt-related ODA between 2000 and 2013 by region
2 The United States, France, Germany, Japan and the United Kingdom accounted for 36% of the
total ODA flows in Africa between 2000 and 2013 (Table 5.1).
3 The World Bank, European Communities, African Development Bank and Global Fund to Fight
Aids, Tuberculosis and Malaria are responsible for 38% of the total ODA inflows to Africa
(Table 5.1).
5 Determinants of Foreign Investment and International Aid for Meeting the. . .
167
free of external debt have experienced increases in total domestic revenue and public
investments (Cassimon et al. 2015).
While the overall assistance directed to Africa is roughly distributed proportionally among the sub-regions (Fig. 5.1), certain donor countries tend to prefer specific
regions to allocate ODA funds. This possibly reflects past colonial ties and present
social and economic interests (Zanger 2000). For example, the top five donor
countries
2 targeted mainly North and East Africa (Table 5.1). The United States
and the United Kingdom focus their ODA primarily on East Africa (44% and 50%,
respectively), while France focuses mainly on North Africa (43% of its total ODA).
Germany and Japan, on the other hand, split their ODA between North and East
Africa (52% and 70% of their total ODA respectively). Similarly, the top four
international agencies in terms of ODA
3 focus predominately on East and West
Africa (41% and 29%, respectively) (Table 5.1).
Figure 5.3a highlights the research priorities related to individual SDGs as
captured by Boafo et al. (2018). There is extensive literature for SDG5 (Gender
equality) (Chap. 1 Vol. 1; Chap. 4 Vol. 2), SDG13 (Climate action) (Chap. 1. Vol. 1;
Chaps. 2 and 3 Vol. 2), and SDG1 (No poverty) (Chap. 1 Vol. 1). This is evident in
Cluster 3 of Fig. 5.3a. However, the actual funding directed to those SDGs is
relatively low (Fig. 5.3b). As a matter of fact, these research priorities reflect some
Fig. 5.2 Debt-related ODA between 2000 and 2013 by region
2 The United States, France, Germany, Japan and the United Kingdom accounted for 36% of the
total ODA flows in Africa between 2000 and 2013 (Table 5.1).
3 The World Bank, European Communities, African Development Bank and Global Fund to Fight
Aids, Tuberculosis and Malaria are responsible for 38% of the total ODA inflows to Africa
(Table 5.1).
5 Determinants of Foreign Investment and International Aid for Meeting the. . .
167