

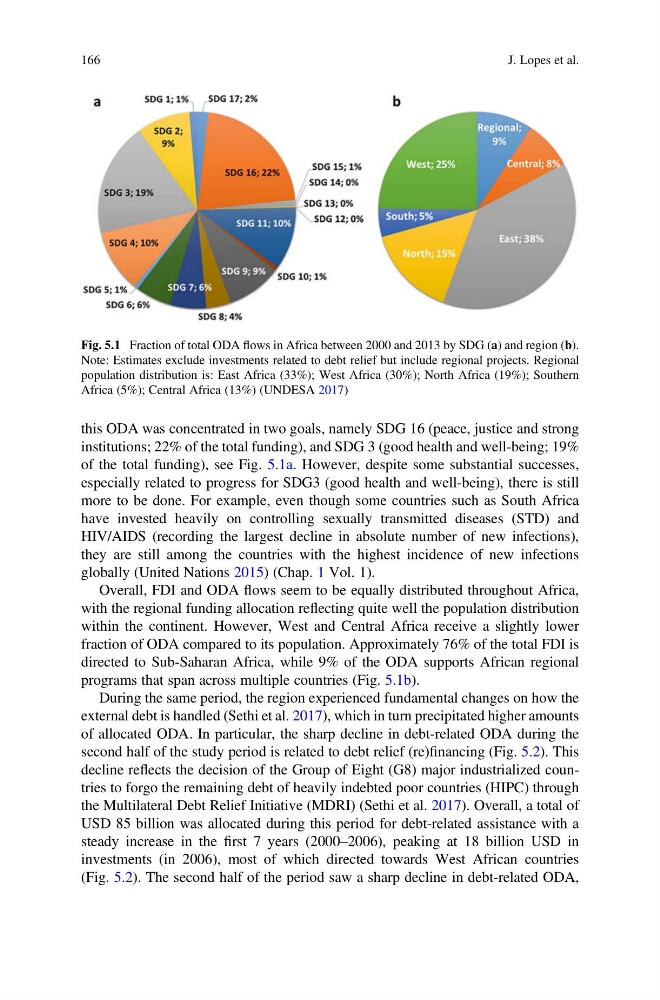
this ODA was concentrated in two goals, namely SDG 16 (peace, justice and strong
institutions; 22% of the total funding), and SDG 3 (good health and well-being; 19%
of the total funding), see Fig. 5.1a. However, despite some substantial successes,
especially related to progress for SDG3 (good health and well-being), there is still
more to be done. For example, even though some countries such as South Africa
have invested heavily on controlling sexually transmitted diseases (STD) and
HIV/AIDS (recording the largest decline in absolute number of new infections),
they are still among the countries with the highest incidence of new infections
globally (United Nations 2015) (Chap. 1 Vol. 1).
Overall, FDI and ODA flows seem to be equally distributed throughout Africa,
with the regional funding allocation reflecting quite well the population distribution
within the continent. However, West and Central Africa receive a slightly lower
fraction of ODA compared to its population. Approximately 76% of the total FDI is
directed to Sub-Saharan Africa, while 9% of the ODA supports African regional
programs that span across multiple countries (Fig. 5.1b).
During the same period, the region experienced fundamental changes on how the
external debt is handled (Sethi et al. 2017), which in turn precipitated higher amounts
of allocated ODA. In particular, the sharp decline in debt-related ODA during the
second half of the study period is related to debt relief (re)financing (Fig. 5.2). This
decline reflects the decision of the Group of Eight (G8) major industrialized countries to forgo the remaining debt of heavily indebted poor countries (HIPC) through
the Multilateral Debt Relief Initiative (MDRI) (Sethi et al. 2017). Overall, a total of
USD 85 billion was allocated during this period for debt-related assistance with a
steady increase in the first 7 years (2000–2006), peaking at 18 billion USD in
investments (in 2006), most of which directed towards West African countries
(Fig. 5.2). The second half of the period saw a sharp decline in debt-related ODA,
Fig. 5.1 Fraction of total ODA flows in Africa between 2000 and 2013 by SDG (a) and region (b).
Note: Estimates exclude investments related to debt relief but include regional projects. Regional
population distribution is: East Africa (33%); West Africa (30%); North Africa (19%); Southern
Africa (5%); Central Africa (13%) (UNDESA 2017)
166
J. Lopes et al.
institutions; 22% of the total funding), and SDG 3 (good health and well-being; 19%
of the total funding), see Fig. 5.1a. However, despite some substantial successes,
especially related to progress for SDG3 (good health and well-being), there is still
more to be done. For example, even though some countries such as South Africa
have invested heavily on controlling sexually transmitted diseases (STD) and
HIV/AIDS (recording the largest decline in absolute number of new infections),
they are still among the countries with the highest incidence of new infections
globally (United Nations 2015) (Chap. 1 Vol. 1).
Overall, FDI and ODA flows seem to be equally distributed throughout Africa,
with the regional funding allocation reflecting quite well the population distribution
within the continent. However, West and Central Africa receive a slightly lower
fraction of ODA compared to its population. Approximately 76% of the total FDI is
directed to Sub-Saharan Africa, while 9% of the ODA supports African regional
programs that span across multiple countries (Fig. 5.1b).
During the same period, the region experienced fundamental changes on how the
external debt is handled (Sethi et al. 2017), which in turn precipitated higher amounts
of allocated ODA. In particular, the sharp decline in debt-related ODA during the
second half of the study period is related to debt relief (re)financing (Fig. 5.2). This
decline reflects the decision of the Group of Eight (G8) major industrialized countries to forgo the remaining debt of heavily indebted poor countries (HIPC) through
the Multilateral Debt Relief Initiative (MDRI) (Sethi et al. 2017). Overall, a total of
USD 85 billion was allocated during this period for debt-related assistance with a
steady increase in the first 7 years (2000–2006), peaking at 18 billion USD in
investments (in 2006), most of which directed towards West African countries
(Fig. 5.2). The second half of the period saw a sharp decline in debt-related ODA,
Fig. 5.1 Fraction of total ODA flows in Africa between 2000 and 2013 by SDG (a) and region (b).
Note: Estimates exclude investments related to debt relief but include regional projects. Regional
population distribution is: East Africa (33%); West Africa (30%); North Africa (19%); Southern
Africa (5%); Central Africa (13%) (UNDESA 2017)
166
J. Lopes et al.