

corruption (Table 4.3). The combined effects of the above make them vulnerable to
the potential adverse impacts of LSLAs (see Sect. 4.1).
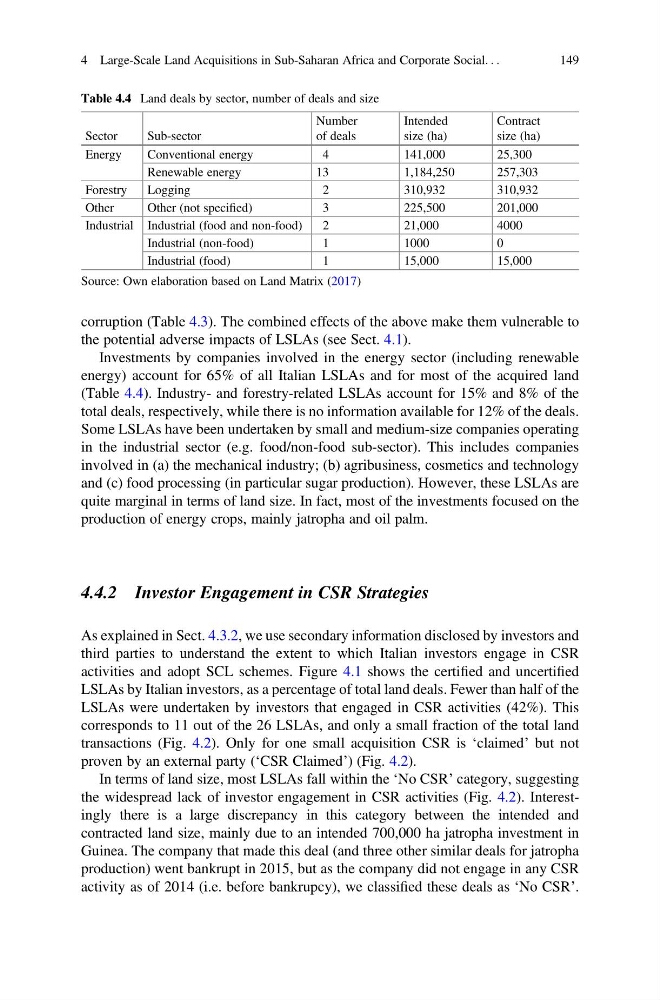
Investments by companies involved in the energy sector (including renewable
energy) account for 65% of all Italian LSLAs and for most of the acquired land
(Table 4.4). Industry- and forestry-related LSLAs account for 15% and 8% of the
total deals, respectively, while there is no information available for 12% of the deals.
Some LSLAs have been undertaken by small and medium-size companies operating
in the industrial sector (e.g. food/non-food sub-sector). This includes companies
involved in (a) the mechanical industry; (b) agribusiness, cosmetics and technology
and (c) food processing (in particular sugar production). However, these LSLAs are
quite marginal in terms of land size. In fact, most of the investments focused on the
production of energy crops, mainly jatropha and oil palm.
4.4.2 Investor Engagement in CSR Strategies
As explained in Sect. 4.3.2, we use secondary information disclosed by investors and
third parties to understand the extent to which Italian investors engage in CSR
activities and adopt SCL schemes. Figure 4.1 shows the certified and uncertified
LSLAs by Italian investors, as a percentage of total land deals. Fewer than half of the
LSLAs were undertaken by investors that engaged in CSR activities (42%). This
corresponds to 11 out of the 26 LSLAs, and only a small fraction of the total land
transactions (Fig. 4.2). Only for one small acquisition CSR is ‘claimed’ but not
proven by an external party (‘CSR Claimed’) (Fig. 4.2).
In terms of land size, most LSLAs fall within the ‘No CSR’ category, suggesting
the widespread lack of investor engagement in CSR activities (Fig. 4.2). Interestingly there is a large discrepancy in this category between the intended and
contracted land size, mainly due to an intended 700,000 ha jatropha investment in
Guinea. The company that made this deal (and three other similar deals for jatropha
production) went bankrupt in 2015, but as the company did not engage in any CSR
activity as of 2014 (i.e. before bankrupcy), we classified these deals as ‘No CSR’.
Table 4.4 Land deals by sector, number of deals and size
Sector
Sub-sector
Number
of deals
Intended
size (ha)
Contract
size (ha)
Energy
Conventional energy
4
141,000
25,300
Renewable energy
13
1,184,250
257,303
Forestry
Logging
2
310,932
310,932
Other
Other (not specified)
3
225,500
201,000
Industrial Industrial (food and non-food)
2
21,000
4000
Industrial (non-food)
1
1000
0
Industrial (food)
1
15,000
15,000
Source: Own elaboration based on Land Matrix (2017)
4 Large-Scale Land Acquisitions in Sub-Saharan Africa and Corporate Social. . .
149
the potential adverse impacts of LSLAs (see Sect. 4.1).
Investments by companies involved in the energy sector (including renewable
energy) account for 65% of all Italian LSLAs and for most of the acquired land
(Table 4.4). Industry- and forestry-related LSLAs account for 15% and 8% of the
total deals, respectively, while there is no information available for 12% of the deals.
Some LSLAs have been undertaken by small and medium-size companies operating
in the industrial sector (e.g. food/non-food sub-sector). This includes companies
involved in (a) the mechanical industry; (b) agribusiness, cosmetics and technology
and (c) food processing (in particular sugar production). However, these LSLAs are
quite marginal in terms of land size. In fact, most of the investments focused on the
production of energy crops, mainly jatropha and oil palm.
4.4.2 Investor Engagement in CSR Strategies
As explained in Sect. 4.3.2, we use secondary information disclosed by investors and
third parties to understand the extent to which Italian investors engage in CSR
activities and adopt SCL schemes. Figure 4.1 shows the certified and uncertified
LSLAs by Italian investors, as a percentage of total land deals. Fewer than half of the
LSLAs were undertaken by investors that engaged in CSR activities (42%). This
corresponds to 11 out of the 26 LSLAs, and only a small fraction of the total land
transactions (Fig. 4.2). Only for one small acquisition CSR is ‘claimed’ but not
proven by an external party (‘CSR Claimed’) (Fig. 4.2).
In terms of land size, most LSLAs fall within the ‘No CSR’ category, suggesting
the widespread lack of investor engagement in CSR activities (Fig. 4.2). Interestingly there is a large discrepancy in this category between the intended and
contracted land size, mainly due to an intended 700,000 ha jatropha investment in
Guinea. The company that made this deal (and three other similar deals for jatropha
production) went bankrupt in 2015, but as the company did not engage in any CSR
activity as of 2014 (i.e. before bankrupcy), we classified these deals as ‘No CSR’.
Table 4.4 Land deals by sector, number of deals and size
Sector
Sub-sector
Number
of deals
Intended
size (ha)
Contract
size (ha)
Energy
Conventional energy
4
141,000
25,300
Renewable energy
13
1,184,250
257,303
Forestry
Logging
2
310,932
310,932
Other
Other (not specified)
3
225,500
201,000
Industrial Industrial (food and non-food)
2
21,000
4000
Industrial (non-food)
1
1000
0
Industrial (food)
1
15,000
15,000
Source: Own elaboration based on Land Matrix (2017)
4 Large-Scale Land Acquisitions in Sub-Saharan Africa and Corporate Social. . .
149