

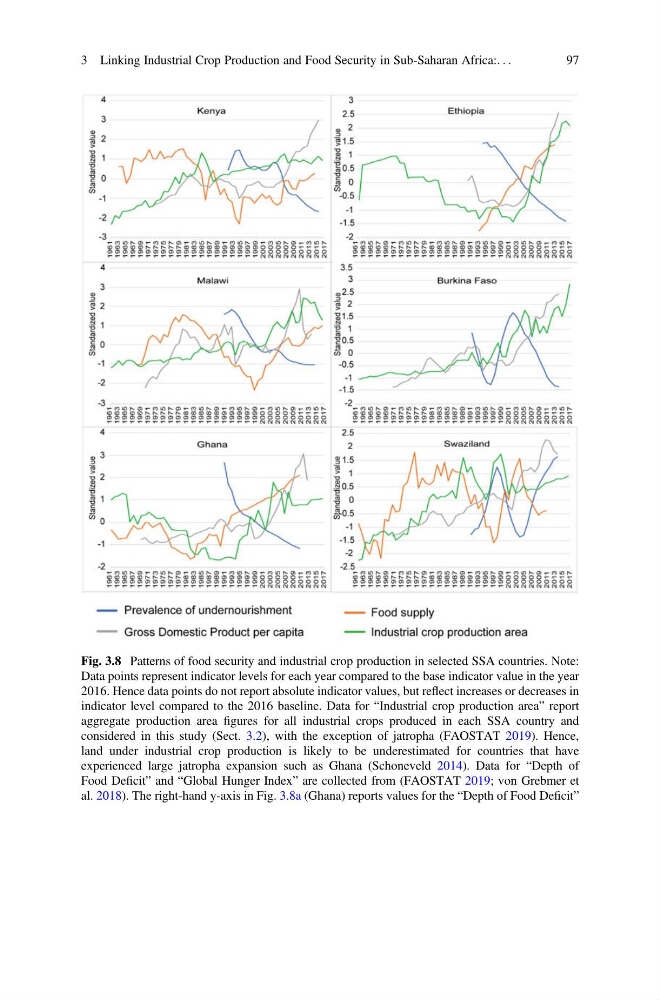
Fig. 3.8 Patterns of food security and industrial crop production in selected SSA countries. Note:
Data points represent indicator levels for each year compared to the base indicator value in the year
2016. Hence data points do not report absolute indicator values, but reflect increases or decreases in
indicator level compared to the 2016 baseline. Data for “Industrial crop production area” report
aggregate production area figures for all industrial crops produced in each SSA country and
considered in this study (Sect. 3.2), with the exception of jatropha (FAOSTAT 2019). Hence,
land under industrial crop production is likely to be underestimated for countries that have
experienced large jatropha expansion such as Ghana (Schoneveld 2014). Data for “Depth of
Food Deficit” and “Global Hunger Index” are collected from (FAOSTAT 2019; von Grebmer et
al. 2018). The right-hand y-axis in Fig. 3.8a (Ghana) reports values for the “Depth of Food Deficit”
3 Linking Industrial Crop Production and Food Security in Sub-Saharan Africa:. . .
97
Data points represent indicator levels for each year compared to the base indicator value in the year
2016. Hence data points do not report absolute indicator values, but reflect increases or decreases in
indicator level compared to the 2016 baseline. Data for “Industrial crop production area” report
aggregate production area figures for all industrial crops produced in each SSA country and
considered in this study (Sect. 3.2), with the exception of jatropha (FAOSTAT 2019). Hence,
land under industrial crop production is likely to be underestimated for countries that have
experienced large jatropha expansion such as Ghana (Schoneveld 2014). Data for “Depth of
Food Deficit” and “Global Hunger Index” are collected from (FAOSTAT 2019; von Grebmer et
al. 2018). The right-hand y-axis in Fig. 3.8a (Ghana) reports values for the “Depth of Food Deficit”
3 Linking Industrial Crop Production and Food Security in Sub-Saharan Africa:. . .
97