

86
R. Abdulla et al.
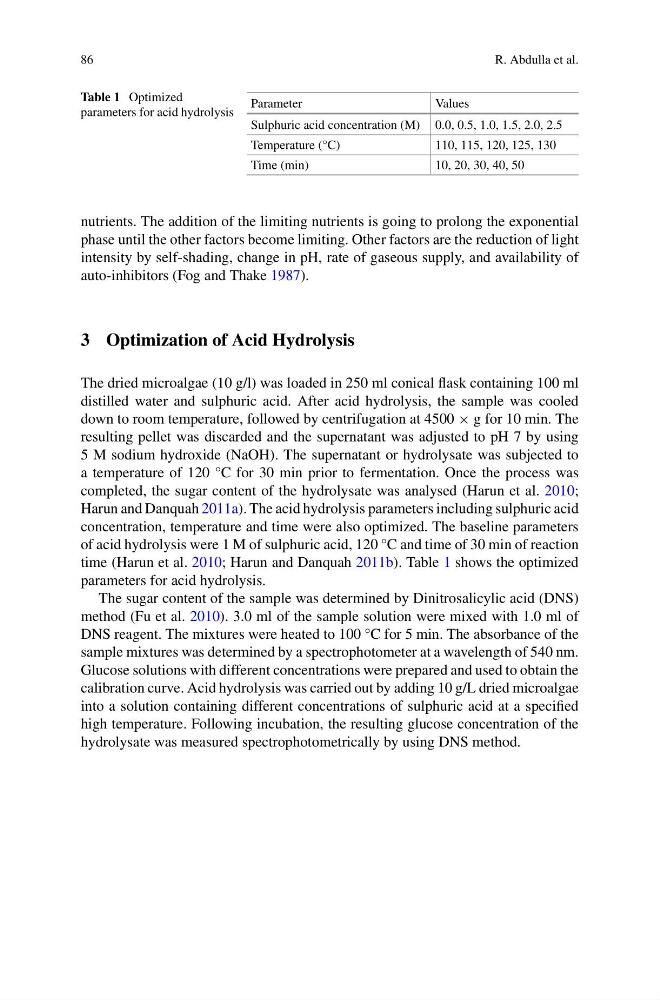
Table 1 Optimized
parameters for acid hydrolysis
Parameter
Values
Sulphuric acid concentration (M) 0.0, 0.5, 1.0, 1.5, 2.0, 2.5
Temperature (°C)
110, 115, 120, 125, 130
Time (min)
10, 20, 30, 40, 50
nutrients. The addition of the limiting nutrients is going to prolong the exponential
phase until the other factors become limiting. Other factors are the reduction of light
intensity by self-shading, change in pH, rate of gaseous supply, and availability of
auto-inhibitors (Fog and Thake 1987).
3 Optimization of Acid Hydrolysis
The dried microalgae (10 g/l) was loaded in 250 ml conical flask containing 100 ml
distilled water and sulphuric acid. After acid hydrolysis, the sample was cooled
down to room temperature, followed by centrifugation at 4500 × g for 10 min. The
resulting pellet was discarded and the supernatant was adjusted to pH 7 by using
5 M sodium hydroxide (NaOH). The supernatant or hydrolysate was subjected to
a temperature of 120 °C for 30 min prior to fermentation. Once the process was
completed, the sugar content of the hydrolysate was analysed (Harun et al. 2010;
Harun and Danquah 2011a). The acid hydrolysis parameters including sulphuric acid
concentration, temperature and time were also optimized. The baseline parameters
of acid hydrolysis were 1 M of sulphuric acid, 120 °C and time of 30 min of reaction
time (Harun et al. 2010; Harun and Danquah 2011b). Table 1 shows the optimized
parameters for acid hydrolysis.
The sugar content of the sample was determined by Dinitrosalicylic acid (DNS)
method (Fu et al. 2010). 3.0 ml of the sample solution were mixed with 1.0 ml of
DNS reagent. The mixtures were heated to 100 °C for 5 min. The absorbance of the
sample mixtures was determined by a spectrophotometer at a wavelength of 540 nm.
Glucose solutions with different concentrations were prepared and used to obtain the
calibration curve. Acid hydrolysis was carried out by adding 10 g/L dried microalgae
into a solution containing different concentrations of sulphuric acid at a specified
high temperature. Following incubation, the resulting glucose concentration of the
hydrolysate was measured spectrophotometrically by using DNS method.
R. Abdulla et al.
Table 1 Optimized
parameters for acid hydrolysis
Parameter
Values
Sulphuric acid concentration (M) 0.0, 0.5, 1.0, 1.5, 2.0, 2.5
Temperature (°C)
110, 115, 120, 125, 130
Time (min)
10, 20, 30, 40, 50
nutrients. The addition of the limiting nutrients is going to prolong the exponential
phase until the other factors become limiting. Other factors are the reduction of light
intensity by self-shading, change in pH, rate of gaseous supply, and availability of
auto-inhibitors (Fog and Thake 1987).
3 Optimization of Acid Hydrolysis
The dried microalgae (10 g/l) was loaded in 250 ml conical flask containing 100 ml
distilled water and sulphuric acid. After acid hydrolysis, the sample was cooled
down to room temperature, followed by centrifugation at 4500 × g for 10 min. The
resulting pellet was discarded and the supernatant was adjusted to pH 7 by using
5 M sodium hydroxide (NaOH). The supernatant or hydrolysate was subjected to
a temperature of 120 °C for 30 min prior to fermentation. Once the process was
completed, the sugar content of the hydrolysate was analysed (Harun et al. 2010;
Harun and Danquah 2011a). The acid hydrolysis parameters including sulphuric acid
concentration, temperature and time were also optimized. The baseline parameters
of acid hydrolysis were 1 M of sulphuric acid, 120 °C and time of 30 min of reaction
time (Harun et al. 2010; Harun and Danquah 2011b). Table 1 shows the optimized
parameters for acid hydrolysis.
The sugar content of the sample was determined by Dinitrosalicylic acid (DNS)
method (Fu et al. 2010). 3.0 ml of the sample solution were mixed with 1.0 ml of
DNS reagent. The mixtures were heated to 100 °C for 5 min. The absorbance of the
sample mixtures was determined by a spectrophotometer at a wavelength of 540 nm.
Glucose solutions with different concentrations were prepared and used to obtain the
calibration curve. Acid hydrolysis was carried out by adding 10 g/L dried microalgae
into a solution containing different concentrations of sulphuric acid at a specified
high temperature. Following incubation, the resulting glucose concentration of the
hydrolysate was measured spectrophotometrically by using DNS method.