

200
N. Bolong and I. Saad
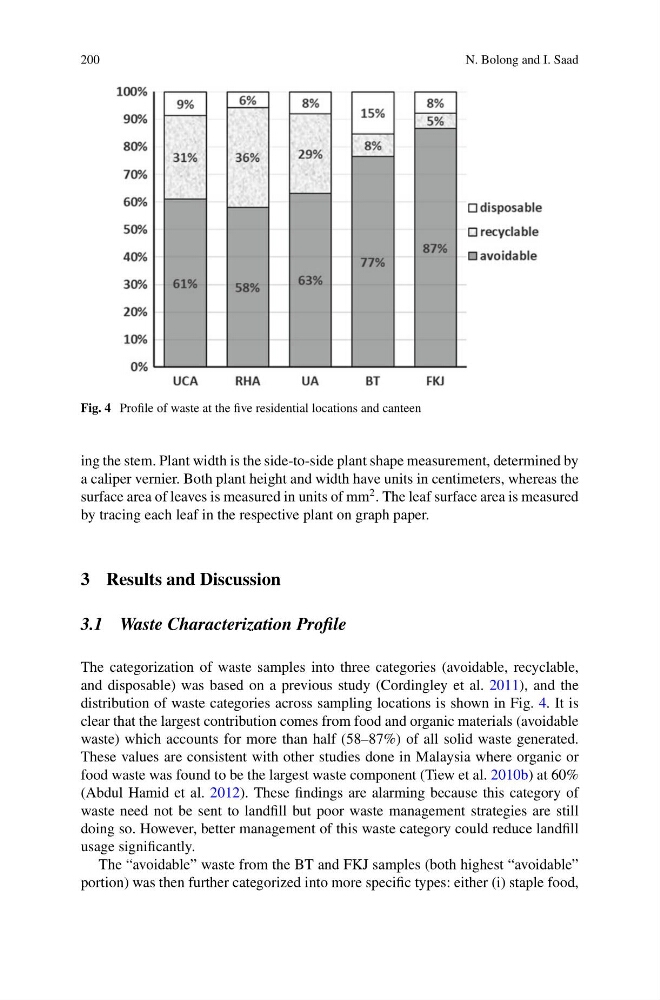
Fig. 4 Profile of waste at the five residential locations and canteen
ing the stem. Plant width is the side-to-side plant shape measurement, determined by
a caliper vernier. Both plant height and width have units in centimeters, whereas the
surface area of leaves is measured in units of mm
2 . The leaf surface area is measured
by tracing each leaf in the respective plant on graph paper.
3 Results and Discussion
3.1 Waste Characterization Profile
The categorization of waste samples into three categories (avoidable, recyclable,
and disposable) was based on a previous study (Cordingley et al. 2011), and the
distribution of waste categories across sampling locations is shown in Fig. 4. It is
clear that the largest contribution comes from food and organic materials (avoidable
waste) which accounts for more than half (58–87%) of all solid waste generated.
These values are consistent with other studies done in Malaysia where organic or
food waste was found to be the largest waste component (Tiew et al. 2010b) at 60%
(Abdul Hamid et al. 2012). These findings are alarming because this category of
waste need not be sent to landfill but poor waste management strategies are still
doing so. However, better management of this waste category could reduce landfill
usage significantly.
The “avoidable” waste from the BT and FKJ samples (both highest “avoidable”
portion) was then further categorized into more specific types: either (i) staple food,
N. Bolong and I. Saad
Fig. 4 Profile of waste at the five residential locations and canteen
ing the stem. Plant width is the side-to-side plant shape measurement, determined by
a caliper vernier. Both plant height and width have units in centimeters, whereas the
surface area of leaves is measured in units of mm
2 . The leaf surface area is measured
by tracing each leaf in the respective plant on graph paper.
3 Results and Discussion
3.1 Waste Characterization Profile
The categorization of waste samples into three categories (avoidable, recyclable,
and disposable) was based on a previous study (Cordingley et al. 2011), and the
distribution of waste categories across sampling locations is shown in Fig. 4. It is
clear that the largest contribution comes from food and organic materials (avoidable
waste) which accounts for more than half (58–87%) of all solid waste generated.
These values are consistent with other studies done in Malaysia where organic or
food waste was found to be the largest waste component (Tiew et al. 2010b) at 60%
(Abdul Hamid et al. 2012). These findings are alarming because this category of
waste need not be sent to landfill but poor waste management strategies are still
doing so. However, better management of this waste category could reduce landfill
usage significantly.
The “avoidable” waste from the BT and FKJ samples (both highest “avoidable”
portion) was then further categorized into more specific types: either (i) staple food,