

184
S. Saalah et al.
2918
3216
3877
3052
2733
0.00
1000.00
2000.00
3000.00
4000.00
5000.00
6000.00
MONDAY
TUESDAY
WEDNESDAY
THURSDAY
FRIDAY
Density (kg/m3)
Days
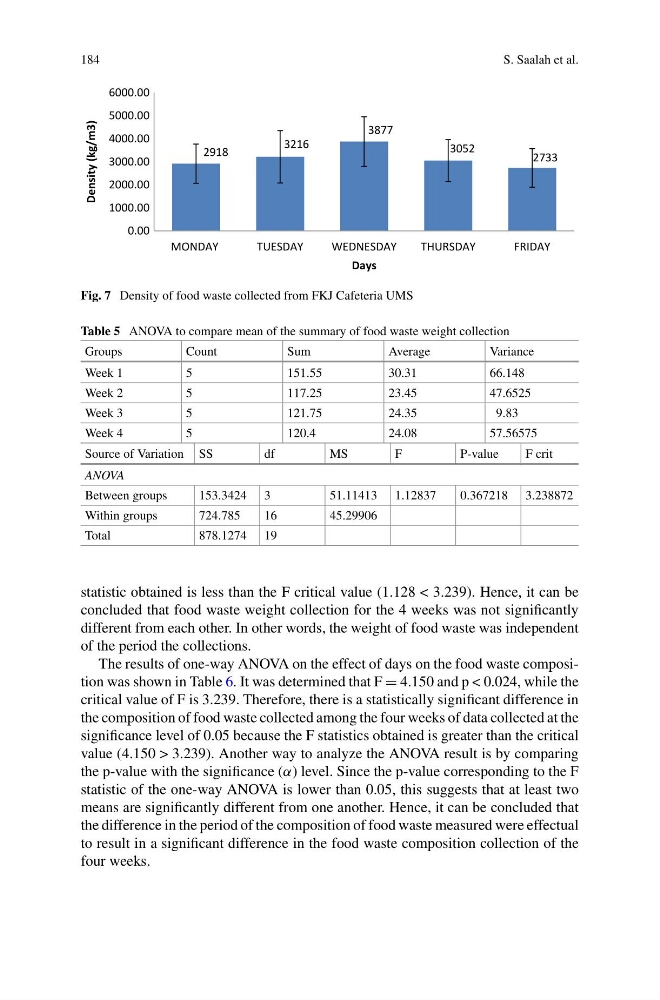
Fig. 7 Density of food waste collected from FKJ Cafeteria UMS
Table 5 ANOVA to compare mean of the summary of food waste weight collection
Groups
Count
Sum
Average
Variance
Week 1
5
151.55
30.31
66.148
Week 2
5
117.25
23.45
47.6525
Week 3
5
121.75
24.35
9.83
Week 4
5
120.4
24.08
57.56575
Source of Variation SS
df
MS
F
P-value
F crit
ANOVA
Between groups
153.3424 3
51.11413 1.12837
0.367218 3.238872
Within groups
724.785
16
45.29906
Total
878.1274 19
statistic obtained is less than the F critical value (1.128 < 3.239). Hence, it can be
concluded that food waste weight collection for the 4 weeks was not significantly
different from each other. In other words, the weight of food waste was independent
of the period the collections.
The results of one-way ANOVA on the effect of days on the food waste composition was shown in Table 6. It was determined that F = 4.150 and p < 0.024, while the
critical value of F is 3.239. Therefore, there is a statistically significant difference in
the composition of food waste collected among the four weeks of data collected at the
significance level of 0.05 because the F statistics obtained is greater than the critical
value (4.150 > 3.239). Another way to analyze the ANOVA result is by comparing
the p-value with the significance (α) level. Since the p-value corresponding to the F
statistic of the one-way ANOVA is lower than 0.05, this suggests that at least two
means are significantly different from one another. Hence, it can be concluded that
the difference in the period of the composition of food waste measured were effectual
to result in a significant difference in the food waste composition collection of the
four weeks.
S. Saalah et al.
2918
3216
3877
3052
2733
0.00
1000.00
2000.00
3000.00
4000.00
5000.00
6000.00
MONDAY
TUESDAY
WEDNESDAY
THURSDAY
FRIDAY
Density (kg/m3)
Days
Fig. 7 Density of food waste collected from FKJ Cafeteria UMS
Table 5 ANOVA to compare mean of the summary of food waste weight collection
Groups
Count
Sum
Average
Variance
Week 1
5
151.55
30.31
66.148
Week 2
5
117.25
23.45
47.6525
Week 3
5
121.75
24.35
9.83
Week 4
5
120.4
24.08
57.56575
Source of Variation SS
df
MS
F
P-value
F crit
ANOVA
Between groups
153.3424 3
51.11413 1.12837
0.367218 3.238872
Within groups
724.785
16
45.29906
Total
878.1274 19
statistic obtained is less than the F critical value (1.128 < 3.239). Hence, it can be
concluded that food waste weight collection for the 4 weeks was not significantly
different from each other. In other words, the weight of food waste was independent
of the period the collections.
The results of one-way ANOVA on the effect of days on the food waste composition was shown in Table 6. It was determined that F = 4.150 and p < 0.024, while the
critical value of F is 3.239. Therefore, there is a statistically significant difference in
the composition of food waste collected among the four weeks of data collected at the
significance level of 0.05 because the F statistics obtained is greater than the critical
value (4.150 > 3.239). Another way to analyze the ANOVA result is by comparing
the p-value with the significance (α) level. Since the p-value corresponding to the F
statistic of the one-way ANOVA is lower than 0.05, this suggests that at least two
means are significantly different from one another. Hence, it can be concluded that
the difference in the period of the composition of food waste measured were effectual
to result in a significant difference in the food waste composition collection of the
four weeks.