

The Effect of Enzyme Addition on the Anaerobic Digestion …
127
3.0
4.0
5.0
6.0
7.0
8.0
9.0
0
1 0
2 0
3 0
4 0
5 0
Electrical Conductivity, mS/cm
Time, days
Food Waste
Food Waste
and Lipase
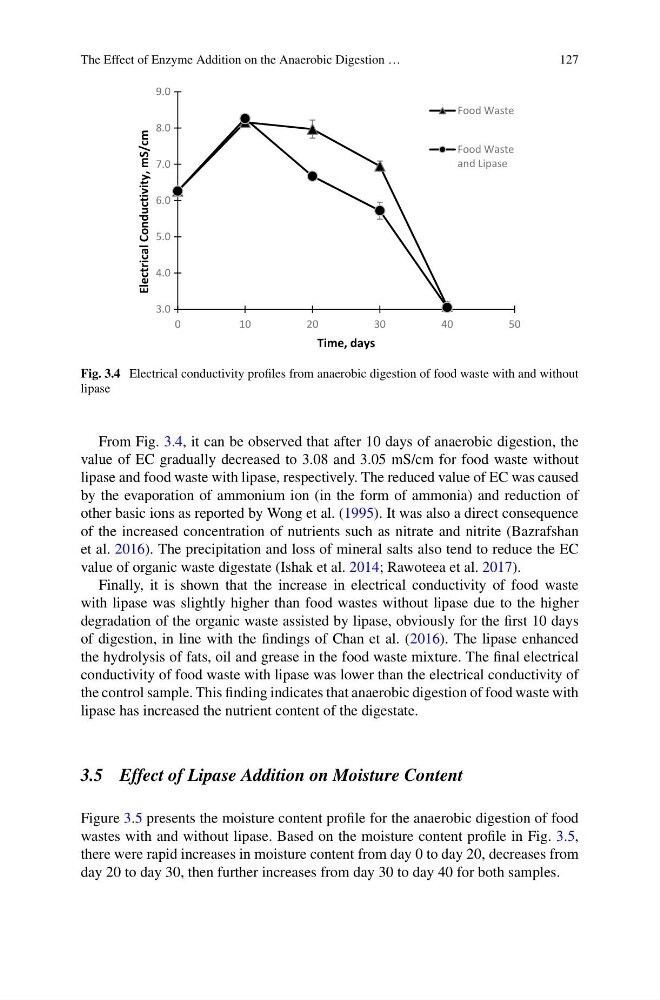
Fig. 3.4 Electrical conductivity profiles from anaerobic digestion of food waste with and without
lipase
From Fig. 3.4, it can be observed that after 10 days of anaerobic digestion, the
value of EC gradually decreased to 3.08 and 3.05 mS/cm for food waste without
lipase and food waste with lipase, respectively. The reduced value of EC was caused
by the evaporation of ammonium ion (in the form of ammonia) and reduction of
other basic ions as reported by Wong et al. (1995). It was also a direct consequence
of the increased concentration of nutrients such as nitrate and nitrite (Bazrafshan
et al. 2016). The precipitation and loss of mineral salts also tend to reduce the EC
value of organic waste digestate (Ishak et al. 2014; Rawoteea et al. 2017).
Finally, it is shown that the increase in electrical conductivity of food waste
with lipase was slightly higher than food wastes without lipase due to the higher
degradation of the organic waste assisted by lipase, obviously for the first 10 days
of digestion, in line with the findings of Chan et al. (2016). The lipase enhanced
the hydrolysis of fats, oil and grease in the food waste mixture. The final electrical
conductivity of food waste with lipase was lower than the electrical conductivity of
the control sample. This finding indicates that anaerobic digestion of food waste with
lipase has increased the nutrient content of the digestate.
3.5 Effect of Lipase Addition on Moisture Content
Figure 3.5 presents the moisture content profile for the anaerobic digestion of food
wastes with and without lipase. Based on the moisture content profile in Fig. 3.5,
there were rapid increases in moisture content from day 0 to day 20, decreases from
day 20 to day 30, then further increases from day 30 to day 40 for both samples.
127
3.0
4.0
5.0
6.0
7.0
8.0
9.0
0
1 0
2 0
3 0
4 0
5 0
Electrical Conductivity, mS/cm
Time, days
Food Waste
Food Waste
and Lipase
Fig. 3.4 Electrical conductivity profiles from anaerobic digestion of food waste with and without
lipase
From Fig. 3.4, it can be observed that after 10 days of anaerobic digestion, the
value of EC gradually decreased to 3.08 and 3.05 mS/cm for food waste without
lipase and food waste with lipase, respectively. The reduced value of EC was caused
by the evaporation of ammonium ion (in the form of ammonia) and reduction of
other basic ions as reported by Wong et al. (1995). It was also a direct consequence
of the increased concentration of nutrients such as nitrate and nitrite (Bazrafshan
et al. 2016). The precipitation and loss of mineral salts also tend to reduce the EC
value of organic waste digestate (Ishak et al. 2014; Rawoteea et al. 2017).
Finally, it is shown that the increase in electrical conductivity of food waste
with lipase was slightly higher than food wastes without lipase due to the higher
degradation of the organic waste assisted by lipase, obviously for the first 10 days
of digestion, in line with the findings of Chan et al. (2016). The lipase enhanced
the hydrolysis of fats, oil and grease in the food waste mixture. The final electrical
conductivity of food waste with lipase was lower than the electrical conductivity of
the control sample. This finding indicates that anaerobic digestion of food waste with
lipase has increased the nutrient content of the digestate.
3.5 Effect of Lipase Addition on Moisture Content
Figure 3.5 presents the moisture content profile for the anaerobic digestion of food
wastes with and without lipase. Based on the moisture content profile in Fig. 3.5,
there were rapid increases in moisture content from day 0 to day 20, decreases from
day 20 to day 30, then further increases from day 30 to day 40 for both samples.