

114
S. Krishnan et al.
Table 3 Total average daily landscape wastes collection
Average trip
Zone
Dry leaves
(%)
Gunny sacks Twigs
(%)
Branches
(%)
Palm frond
(%)
Wood
(%)
1
74
32.5
20
9.35
11
10
2
57
47.75
13
11
10
11
3
30
12.5
5
5
5
5
4
93
44.5
12
5
7
1
5
82
35.5
11
9.30
11
8
6
90
54.5
9
10.70
8
7
89
32
15
5.70
13
3
8
47
4
3
9
35
24
4
4
5
3
10
44
6
5
4
11
76
7
26
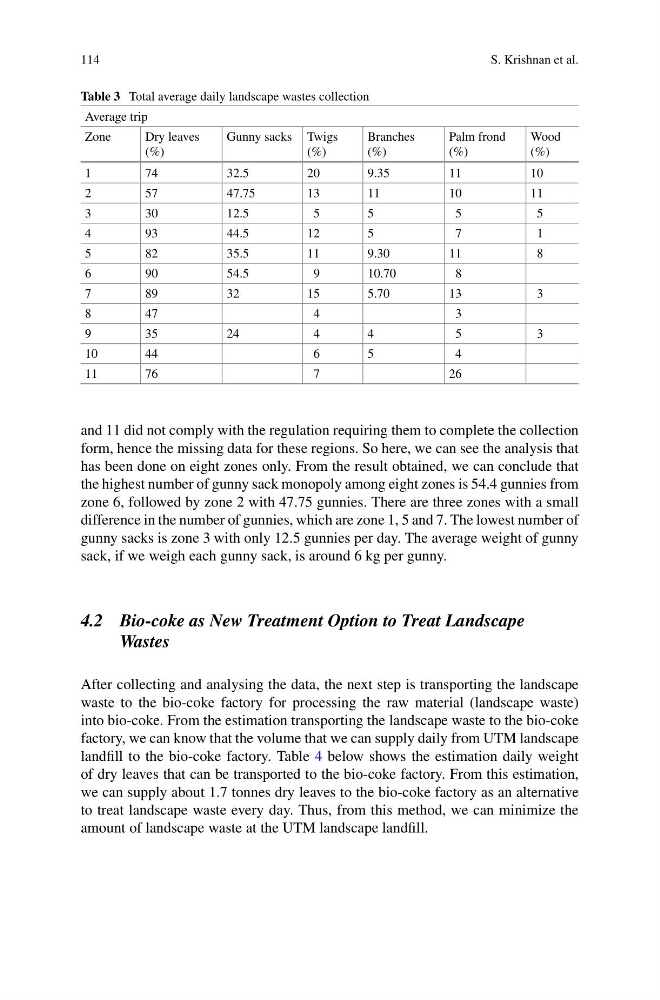
and 11 did not comply with the regulation requiring them to complete the collection
form, hence the missing data for these regions. So here, we can see the analysis that
has been done on eight zones only. From the result obtained, we can conclude that
the highest number of gunny sack monopoly among eight zones is 54.4 gunnies from
zone 6, followed by zone 2 with 47.75 gunnies. There are three zones with a small
difference in the number of gunnies, which are zone 1, 5 and 7. The lowest number of
gunny sacks is zone 3 with only 12.5 gunnies per day. The average weight of gunny
sack, if we weigh each gunny sack, is around 6 kg per gunny.
4.2 Bio-coke as New Treatment Option to Treat Landscape
Wastes
After collecting and analysing the data, the next step is transporting the landscape
waste to the bio-coke factory for processing the raw material (landscape waste)
into bio-coke. From the estimation transporting the landscape waste to the bio-coke
factory, we can know that the volume that we can supply daily from UTM landscape
landfill to the bio-coke factory. Table 4 below shows the estimation daily weight
of dry leaves that can be transported to the bio-coke factory. From this estimation,
we can supply about 1.7 tonnes dry leaves to the bio-coke factory as an alternative
to treat landscape waste every day. Thus, from this method, we can minimize the
amount of landscape waste at the UTM landscape landfill.
S. Krishnan et al.
Table 3 Total average daily landscape wastes collection
Average trip
Zone
Dry leaves
(%)
Gunny sacks Twigs
(%)
Branches
(%)
Palm frond
(%)
Wood
(%)
1
74
32.5
20
9.35
11
10
2
57
47.75
13
11
10
11
3
30
12.5
5
5
5
5
4
93
44.5
12
5
7
1
5
82
35.5
11
9.30
11
8
6
90
54.5
9
10.70
8
7
89
32
15
5.70
13
3
8
47
4
3
9
35
24
4
4
5
3
10
44
6
5
4
11
76
7
26
and 11 did not comply with the regulation requiring them to complete the collection
form, hence the missing data for these regions. So here, we can see the analysis that
has been done on eight zones only. From the result obtained, we can conclude that
the highest number of gunny sack monopoly among eight zones is 54.4 gunnies from
zone 6, followed by zone 2 with 47.75 gunnies. There are three zones with a small
difference in the number of gunnies, which are zone 1, 5 and 7. The lowest number of
gunny sacks is zone 3 with only 12.5 gunnies per day. The average weight of gunny
sack, if we weigh each gunny sack, is around 6 kg per gunny.
4.2 Bio-coke as New Treatment Option to Treat Landscape
Wastes
After collecting and analysing the data, the next step is transporting the landscape
waste to the bio-coke factory for processing the raw material (landscape waste)
into bio-coke. From the estimation transporting the landscape waste to the bio-coke
factory, we can know that the volume that we can supply daily from UTM landscape
landfill to the bio-coke factory. Table 4 below shows the estimation daily weight
of dry leaves that can be transported to the bio-coke factory. From this estimation,
we can supply about 1.7 tonnes dry leaves to the bio-coke factory as an alternative
to treat landscape waste every day. Thus, from this method, we can minimize the
amount of landscape waste at the UTM landscape landfill.