

Microalgae Chlorella as a Sustainable Feedstock …
95
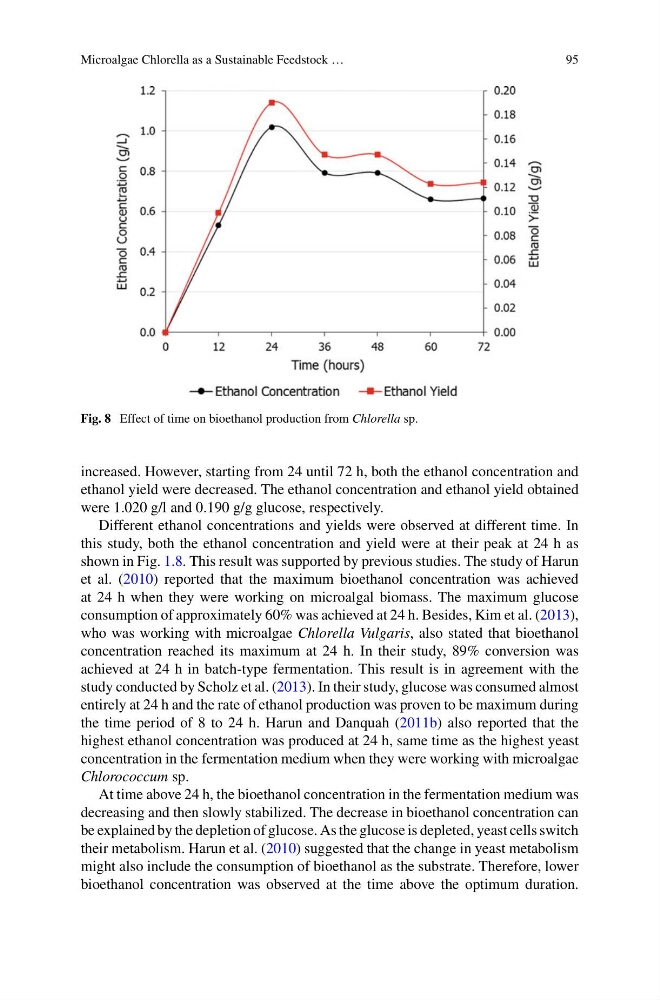
Fig. 8 Effect of time on bioethanol production from Chlorella sp.
increased. However, starting from 24 until 72 h, both the ethanol concentration and
ethanol yield were decreased. The ethanol concentration and ethanol yield obtained
were 1.020 g/l and 0.190 g/g glucose, respectively.
Different ethanol concentrations and yields were observed at different time. In
this study, both the ethanol concentration and yield were at their peak at 24 h as
shown in Fig. 1.8. This result was supported by previous studies. The study of Harun
et al. (2010) reported that the maximum bioethanol concentration was achieved
at 24 h when they were working on microalgal biomass. The maximum glucose
consumption of approximately 60% was achieved at 24 h. Besides, Kim et al. (2013),
who was working with microalgae Chlorella Vulgaris, also stated that bioethanol
concentration reached its maximum at 24 h. In their study, 89% conversion was
achieved at 24 h in batch-type fermentation. This result is in agreement with the
study conducted by Scholz et al. (2013). In their study, glucose was consumed almost
entirely at 24 h and the rate of ethanol production was proven to be maximum during
the time period of 8 to 24 h. Harun and Danquah (2011b) also reported that the
highest ethanol concentration was produced at 24 h, same time as the highest yeast
concentration in the fermentation medium when they were working with microalgae
Chlorococcum sp.
At time above 24 h, the bioethanol concentration in the fermentation medium was
decreasing and then slowly stabilized. The decrease in bioethanol concentration can
be explained by the depletion of glucose. As the glucose is depleted, yeast cells switch
their metabolism. Harun et al. (2010) suggested that the change in yeast metabolism
might also include the consumption of bioethanol as the substrate. Therefore, lower
bioethanol concentration was observed at the time above the optimum duration.
95
Fig. 8 Effect of time on bioethanol production from Chlorella sp.
increased. However, starting from 24 until 72 h, both the ethanol concentration and
ethanol yield were decreased. The ethanol concentration and ethanol yield obtained
were 1.020 g/l and 0.190 g/g glucose, respectively.
Different ethanol concentrations and yields were observed at different time. In
this study, both the ethanol concentration and yield were at their peak at 24 h as
shown in Fig. 1.8. This result was supported by previous studies. The study of Harun
et al. (2010) reported that the maximum bioethanol concentration was achieved
at 24 h when they were working on microalgal biomass. The maximum glucose
consumption of approximately 60% was achieved at 24 h. Besides, Kim et al. (2013),
who was working with microalgae Chlorella Vulgaris, also stated that bioethanol
concentration reached its maximum at 24 h. In their study, 89% conversion was
achieved at 24 h in batch-type fermentation. This result is in agreement with the
study conducted by Scholz et al. (2013). In their study, glucose was consumed almost
entirely at 24 h and the rate of ethanol production was proven to be maximum during
the time period of 8 to 24 h. Harun and Danquah (2011b) also reported that the
highest ethanol concentration was produced at 24 h, same time as the highest yeast
concentration in the fermentation medium when they were working with microalgae
Chlorococcum sp.
At time above 24 h, the bioethanol concentration in the fermentation medium was
decreasing and then slowly stabilized. The decrease in bioethanol concentration can
be explained by the depletion of glucose. As the glucose is depleted, yeast cells switch
their metabolism. Harun et al. (2010) suggested that the change in yeast metabolism
might also include the consumption of bioethanol as the substrate. Therefore, lower
bioethanol concentration was observed at the time above the optimum duration.