

92
R. Abdulla et al.
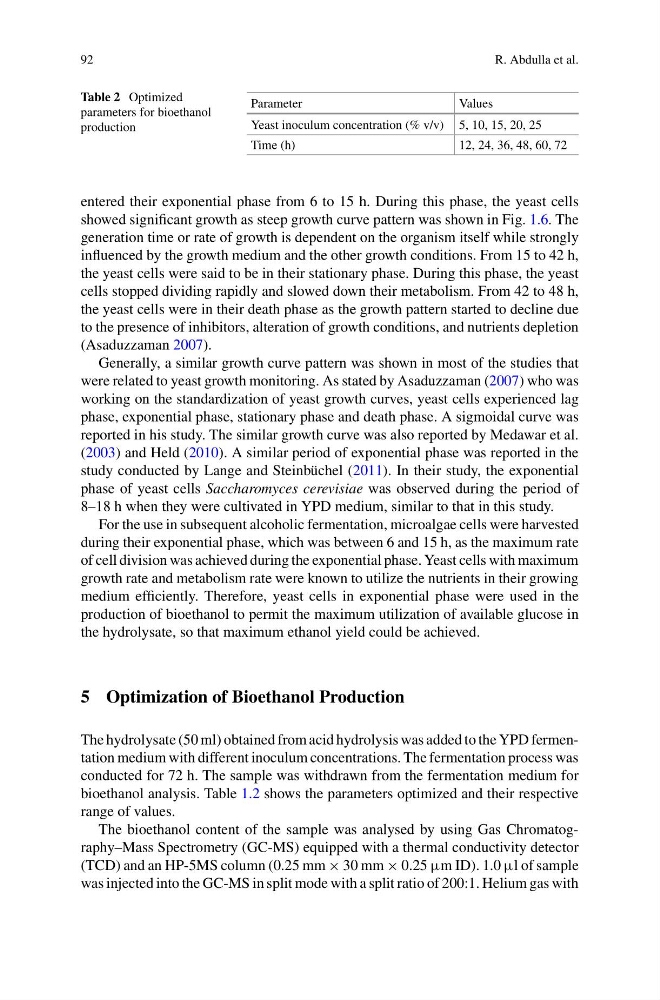
Table 2 Optimized
parameters for bioethanol
production
Parameter
Values
Yeast inoculum concentration (% v/v) 5, 10, 15, 20, 25
Time (h)
12, 24, 36, 48, 60, 72
entered their exponential phase from 6 to 15 h. During this phase, the yeast cells
showed significant growth as steep growth curve pattern was shown in Fig. 1.6. The
generation time or rate of growth is dependent on the organism itself while strongly
influenced by the growth medium and the other growth conditions. From 15 to 42 h,
the yeast cells were said to be in their stationary phase. During this phase, the yeast
cells stopped dividing rapidly and slowed down their metabolism. From 42 to 48 h,
the yeast cells were in their death phase as the growth pattern started to decline due
to the presence of inhibitors, alteration of growth conditions, and nutrients depletion
(Asaduzzaman 2007).
Generally, a similar growth curve pattern was shown in most of the studies that
were related to yeast growth monitoring. As stated by Asaduzzaman (2007) who was
working on the standardization of yeast growth curves, yeast cells experienced lag
phase, exponential phase, stationary phase and death phase. A sigmoidal curve was
reported in his study. The similar growth curve was also reported by Medawar et al.
(2003) and Held (2010). A similar period of exponential phase was reported in the
study conducted by Lange and Steinbüchel (2011). In their study, the exponential
phase of yeast cells Saccharomyces cerevisiae was observed during the period of
8–18 h when they were cultivated in YPD medium, similar to that in this study.
For the use in subsequent alcoholic fermentation, microalgae cells were harvested
during their exponential phase, which was between 6 and 15 h, as the maximum rate
of cell division was achieved during the exponential phase. Yeast cells with maximum
growth rate and metabolism rate were known to utilize the nutrients in their growing
medium efficiently. Therefore, yeast cells in exponential phase were used in the
production of bioethanol to permit the maximum utilization of available glucose in
the hydrolysate, so that maximum ethanol yield could be achieved.
5 Optimization of Bioethanol Production
The hydrolysate (50 ml) obtained from acid hydrolysis was added to the YPD fermentation medium with different inoculum concentrations. The fermentation process was
conducted for 72 h. The sample was withdrawn from the fermentation medium for
bioethanol analysis. Table 1.2 shows the parameters optimized and their respective
range of values.
The bioethanol content of the sample was analysed by using Gas Chromatography–Mass Spectrometry (GC-MS) equipped with a thermal conductivity detector
(TCD) and an HP-5MS column (0.25 mm × 30 mm × 0.25 µm ID). 1.0 µl of sample
was injected into the GC-MS in split mode with a split ratio of 200:1. Helium gas with
R. Abdulla et al.
Table 2 Optimized
parameters for bioethanol
production
Parameter
Values
Yeast inoculum concentration (% v/v) 5, 10, 15, 20, 25
Time (h)
12, 24, 36, 48, 60, 72
entered their exponential phase from 6 to 15 h. During this phase, the yeast cells
showed significant growth as steep growth curve pattern was shown in Fig. 1.6. The
generation time or rate of growth is dependent on the organism itself while strongly
influenced by the growth medium and the other growth conditions. From 15 to 42 h,
the yeast cells were said to be in their stationary phase. During this phase, the yeast
cells stopped dividing rapidly and slowed down their metabolism. From 42 to 48 h,
the yeast cells were in their death phase as the growth pattern started to decline due
to the presence of inhibitors, alteration of growth conditions, and nutrients depletion
(Asaduzzaman 2007).
Generally, a similar growth curve pattern was shown in most of the studies that
were related to yeast growth monitoring. As stated by Asaduzzaman (2007) who was
working on the standardization of yeast growth curves, yeast cells experienced lag
phase, exponential phase, stationary phase and death phase. A sigmoidal curve was
reported in his study. The similar growth curve was also reported by Medawar et al.
(2003) and Held (2010). A similar period of exponential phase was reported in the
study conducted by Lange and Steinbüchel (2011). In their study, the exponential
phase of yeast cells Saccharomyces cerevisiae was observed during the period of
8–18 h when they were cultivated in YPD medium, similar to that in this study.
For the use in subsequent alcoholic fermentation, microalgae cells were harvested
during their exponential phase, which was between 6 and 15 h, as the maximum rate
of cell division was achieved during the exponential phase. Yeast cells with maximum
growth rate and metabolism rate were known to utilize the nutrients in their growing
medium efficiently. Therefore, yeast cells in exponential phase were used in the
production of bioethanol to permit the maximum utilization of available glucose in
the hydrolysate, so that maximum ethanol yield could be achieved.
5 Optimization of Bioethanol Production
The hydrolysate (50 ml) obtained from acid hydrolysis was added to the YPD fermentation medium with different inoculum concentrations. The fermentation process was
conducted for 72 h. The sample was withdrawn from the fermentation medium for
bioethanol analysis. Table 1.2 shows the parameters optimized and their respective
range of values.
The bioethanol content of the sample was analysed by using Gas Chromatography–Mass Spectrometry (GC-MS) equipped with a thermal conductivity detector
(TCD) and an HP-5MS column (0.25 mm × 30 mm × 0.25 µm ID). 1.0 µl of sample
was injected into the GC-MS in split mode with a split ratio of 200:1. Helium gas with