

Microalgae Chlorella as a Sustainable Feedstock …
91
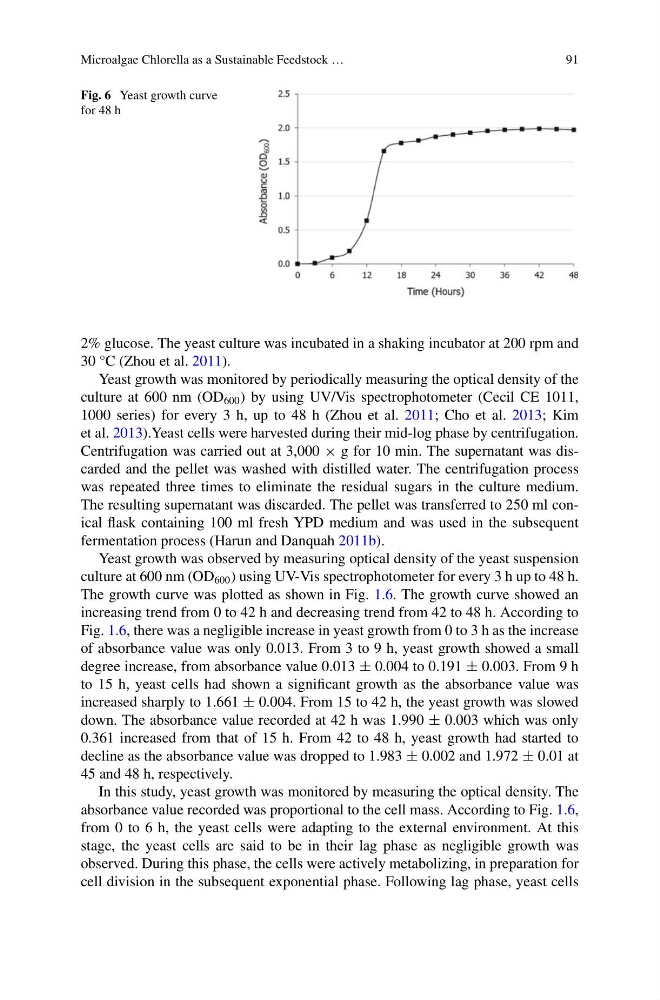
Fig. 6 Yeast growth curve
for 48 h
2% glucose. The yeast culture was incubated in a shaking incubator at 200 rpm and
30 °C (Zhou et al. 2011).
Yeast growth was monitored by periodically measuring the optical density of the
culture at 600 nm (OD 600 ) by using UV/Vis spectrophotometer (Cecil CE 1011,
1000 series) for every 3 h, up to 48 h (Zhou et al. 2011; Cho et al. 2013; Kim
et al. 2013).Yeast cells were harvested during their mid-log phase by centrifugation.
Centrifugation was carried out at 3,000 × g for 10 min. The supernatant was discarded and the pellet was washed with distilled water. The centrifugation process
was repeated three times to eliminate the residual sugars in the culture medium.
The resulting supernatant was discarded. The pellet was transferred to 250 ml conical flask containing 100 ml fresh YPD medium and was used in the subsequent
fermentation process (Harun and Danquah 2011b).
Yeast growth was observed by measuring optical density of the yeast suspension
culture at 600 nm (OD 600 ) using UV-Vis spectrophotometer for every 3 h up to 48 h.
The growth curve was plotted as shown in Fig. 1.6. The growth curve showed an
increasing trend from 0 to 42 h and decreasing trend from 42 to 48 h. According to
Fig. 1.6, there was a negligible increase in yeast growth from 0 to 3 h as the increase
of absorbance value was only 0.013. From 3 to 9 h, yeast growth showed a small
degree increase, from absorbance value 0.013 ± 0.004 to 0.191 ± 0.003. From 9 h
to 15 h, yeast cells had shown a significant growth as the absorbance value was
increased sharply to 1.661 ± 0.004. From 15 to 42 h, the yeast growth was slowed
down. The absorbance value recorded at 42 h was 1.990 ± 0.003 which was only
0.361 increased from that of 15 h. From 42 to 48 h, yeast growth had started to
decline as the absorbance value was dropped to 1.983 ± 0.002 and 1.972 ± 0.01 at
45 and 48 h, respectively.
In this study, yeast growth was monitored by measuring the optical density. The
absorbance value recorded was proportional to the cell mass. According to Fig. 1.6,
from 0 to 6 h, the yeast cells were adapting to the external environment. At this
stage, the yeast cells are said to be in their lag phase as negligible growth was
observed. During this phase, the cells were actively metabolizing, in preparation for
cell division in the subsequent exponential phase. Following lag phase, yeast cells
91
Fig. 6 Yeast growth curve
for 48 h
2% glucose. The yeast culture was incubated in a shaking incubator at 200 rpm and
30 °C (Zhou et al. 2011).
Yeast growth was monitored by periodically measuring the optical density of the
culture at 600 nm (OD 600 ) by using UV/Vis spectrophotometer (Cecil CE 1011,
1000 series) for every 3 h, up to 48 h (Zhou et al. 2011; Cho et al. 2013; Kim
et al. 2013).Yeast cells were harvested during their mid-log phase by centrifugation.
Centrifugation was carried out at 3,000 × g for 10 min. The supernatant was discarded and the pellet was washed with distilled water. The centrifugation process
was repeated three times to eliminate the residual sugars in the culture medium.
The resulting supernatant was discarded. The pellet was transferred to 250 ml conical flask containing 100 ml fresh YPD medium and was used in the subsequent
fermentation process (Harun and Danquah 2011b).
Yeast growth was observed by measuring optical density of the yeast suspension
culture at 600 nm (OD 600 ) using UV-Vis spectrophotometer for every 3 h up to 48 h.
The growth curve was plotted as shown in Fig. 1.6. The growth curve showed an
increasing trend from 0 to 42 h and decreasing trend from 42 to 48 h. According to
Fig. 1.6, there was a negligible increase in yeast growth from 0 to 3 h as the increase
of absorbance value was only 0.013. From 3 to 9 h, yeast growth showed a small
degree increase, from absorbance value 0.013 ± 0.004 to 0.191 ± 0.003. From 9 h
to 15 h, yeast cells had shown a significant growth as the absorbance value was
increased sharply to 1.661 ± 0.004. From 15 to 42 h, the yeast growth was slowed
down. The absorbance value recorded at 42 h was 1.990 ± 0.003 which was only
0.361 increased from that of 15 h. From 42 to 48 h, yeast growth had started to
decline as the absorbance value was dropped to 1.983 ± 0.002 and 1.972 ± 0.01 at
45 and 48 h, respectively.
In this study, yeast growth was monitored by measuring the optical density. The
absorbance value recorded was proportional to the cell mass. According to Fig. 1.6,
from 0 to 6 h, the yeast cells were adapting to the external environment. At this
stage, the yeast cells are said to be in their lag phase as negligible growth was
observed. During this phase, the cells were actively metabolizing, in preparation for
cell division in the subsequent exponential phase. Following lag phase, yeast cells