

should monitor the FIB milling pattern for any image drift and
compensate accordingly with the X/Y shift knobs. Continue milling until the lamella is judged to be thin enough (see Note 11).
Sometimes, the lamella will not be able to survive continued milling
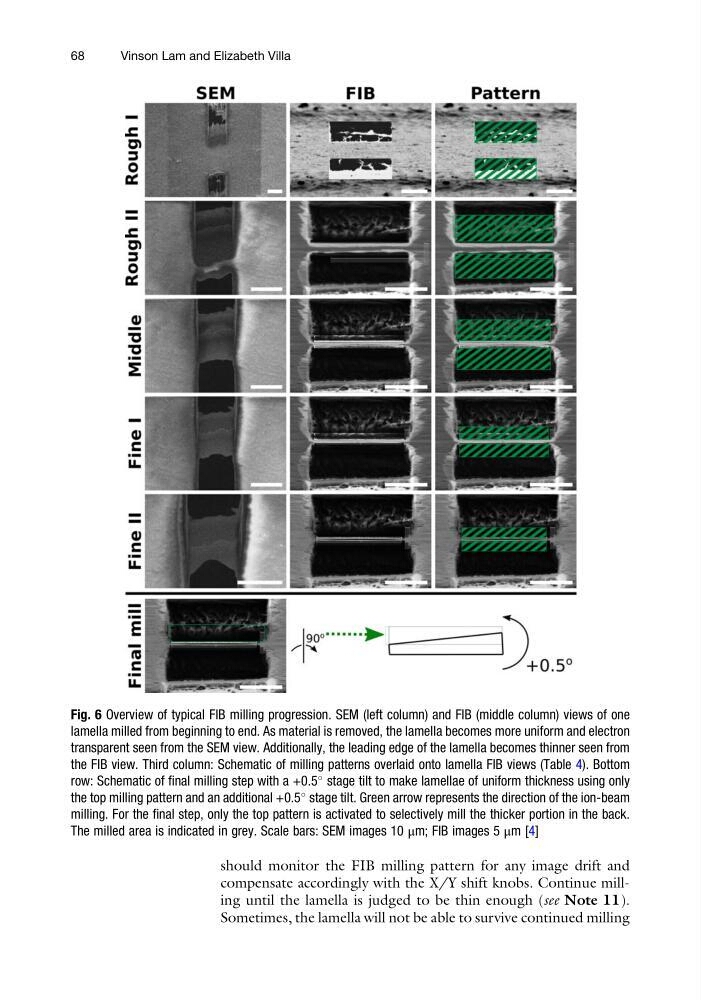
Fig. 6 Overview of typical FIB milling progression. SEM (left column) and FIB (middle column) views of one
lamella milled from beginning to end. As material is removed, the lamella becomes more uniform and electron
transparent seen from the SEM view. Additionally, the leading edge of the lamella becomes thinner seen from
the FIB view. Third column: Schematic of milling patterns overlaid onto lamella FIB views (Table 4). Bottom
row: Schematic of final milling step with a +0.5
stage tilt to make lamellae of uniform thickness using only
the top milling pattern and an additional +0.5
stage tilt. Green arrow represents the direction of the ion-beam
milling. For the final step, only the top pattern is activated to selectively mill the thicker portion in the back.
The milled area is indicated in grey. Scale bars: SEM images 10 μm; FIB images 5 μm [4]
68
Vinson Lam and Elizabeth Villa
compensate accordingly with the X/Y shift knobs. Continue milling until the lamella is judged to be thin enough (see Note 11).
Sometimes, the lamella will not be able to survive continued milling
Fig. 6 Overview of typical FIB milling progression. SEM (left column) and FIB (middle column) views of one
lamella milled from beginning to end. As material is removed, the lamella becomes more uniform and electron
transparent seen from the SEM view. Additionally, the leading edge of the lamella becomes thinner seen from
the FIB view. Third column: Schematic of milling patterns overlaid onto lamella FIB views (Table 4). Bottom
row: Schematic of final milling step with a +0.5
stage tilt to make lamellae of uniform thickness using only
the top milling pattern and an additional +0.5
stage tilt. Green arrow represents the direction of the ion-beam
milling. For the final step, only the top pattern is activated to selectively mill the thicker portion in the back.
The milled area is indicated in grey. Scale bars: SEM images 10 μm; FIB images 5 μm [4]
68
Vinson Lam and Elizabeth Villa