

“Materials” tab, select “Add”. Repeat this for each membrane
compartment (endoplasmic reticulum, vesicles, mitochondria,
etc.).
4. To visualize each segmentation, open the “Project View” window. Generate a surface by right clicking the “labels” data,
selecting “Generate Surface”, and clicking “create”. Under
the “Properties” tab, adjust the smoothing and select “Apply”.
4 Notes
1. Using holey carbon grids serves two purposes: (a) imaging
through the holes (when possible) provides images free from
carbon background and (b) the holes allow more water from
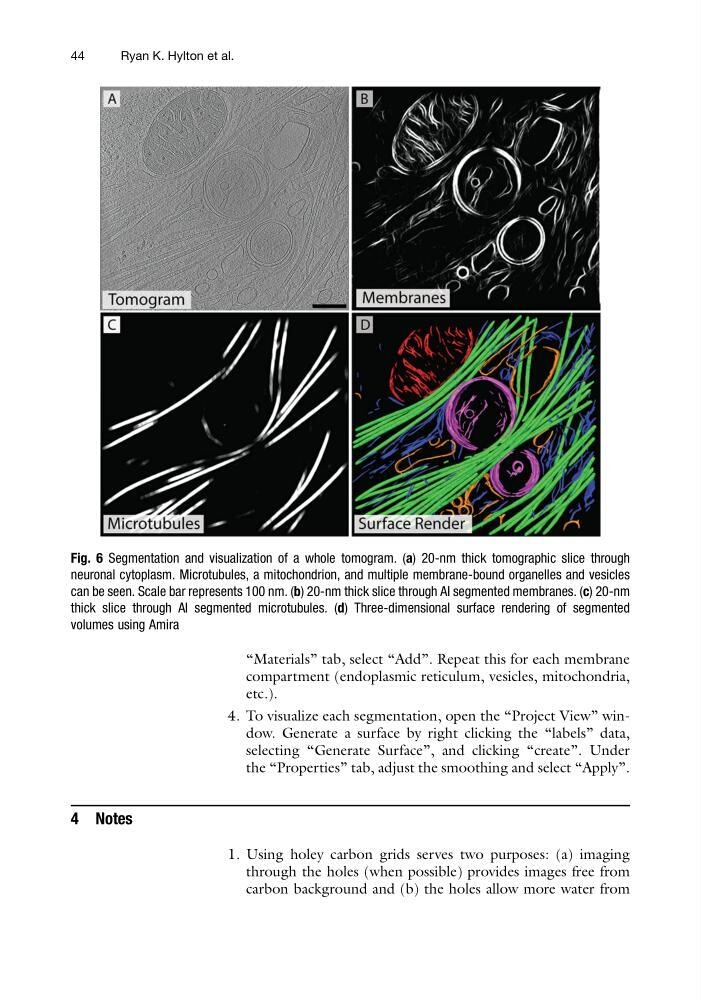
Fig. 6 Segmentation and visualization of a whole tomogram. (a) 20-nm thick tomographic slice through
neuronal cytoplasm. Microtubules, a mitochondrion, and multiple membrane-bound organelles and vesicles
can be seen. Scale bar represents 100 nm. (b) 20-nm thick slice through AI segmented membranes. (c) 20-nm
thick slice through AI segmented microtubules. (d) Three-dimensional surface rendering of segmented
volumes using Amira
44
Ryan K. Hylton et al.
compartment (endoplasmic reticulum, vesicles, mitochondria,
etc.).
4. To visualize each segmentation, open the “Project View” window. Generate a surface by right clicking the “labels” data,
selecting “Generate Surface”, and clicking “create”. Under
the “Properties” tab, adjust the smoothing and select “Apply”.
4 Notes
1. Using holey carbon grids serves two purposes: (a) imaging
through the holes (when possible) provides images free from
carbon background and (b) the holes allow more water from
Fig. 6 Segmentation and visualization of a whole tomogram. (a) 20-nm thick tomographic slice through
neuronal cytoplasm. Microtubules, a mitochondrion, and multiple membrane-bound organelles and vesicles
can be seen. Scale bar represents 100 nm. (b) 20-nm thick slice through AI segmented membranes. (c) 20-nm
thick slice through AI segmented microtubules. (d) Three-dimensional surface rendering of segmented
volumes using Amira
44
Ryan K. Hylton et al.