

subtraction itself can be accomplished from the command line
using RELION [53]. An example command line for this would be:
relion_project --i particles_9_r1-subtract.mrc --subtract_exp --angpix
2.68 --ctf --ang particles_9_r1.star --o subtracted_particles
The mparameters file can then be edited to point to the new
subtracted particles.mrcs stack. If required, the new particle stack
and the subtracted 3D reference can be down-sampled to a coarser
pixel size for computational speedup. Also, the user should set the
nclasses parameter to the number of classes desired. In order to run
the 3D classification, the user should start immediately after the
refinement cycle in which the consensus refinement converged
(e.g., 10, if the auto-refinement converged in cycle 9). Because
the signal-subtracted particles may contain too little signal for
reliable alignments, it is recommended to disable the optimization
of any alignment parameters at this stage and run the classification
for a pre-defined number of cycles (e.g., 40). In this case, the autorefiner will not be used and the 3D classification can be launched
with the command frealign_run_refine. The occupancies of the
particles in each class will be randomized to initialize the classification. Convergence of the 3D classification can be assessed by the
user with the frealign_calc_stats.
3.7 Assessing
Resolution
and Post-Processing
Resolution is typically assessed by computing the FSC curves
[54, 55] between independently (beyond a certain resolution)
refined half-maps. As explained in Subheading 3.3.3, FOCUS
ensures that particles from the same 2D crystal are assigned to the
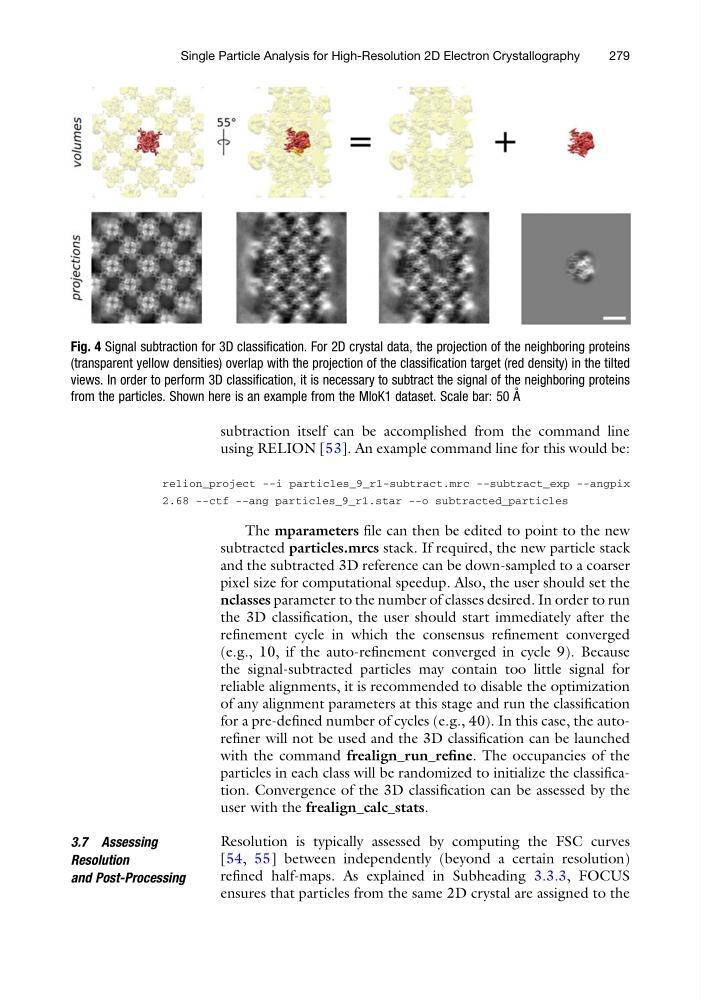
Fig. 4 Signal subtraction for 3D classification. For 2D crystal data, the projection of the neighboring proteins
(transparent yellow densities) overlap with the projection of the classification target (red density) in the tilted
views. In order to perform 3D classification, it is necessary to subtract the signal of the neighboring proteins
from the particles. Shown here is an example from the MloK1 dataset. Scale bar: 50 A ˚
Single Particle Analysis for High-Resolution 2D Electron Crystallography
279
using RELION [53]. An example command line for this would be:
relion_project --i particles_9_r1-subtract.mrc --subtract_exp --angpix
2.68 --ctf --ang particles_9_r1.star --o subtracted_particles
The mparameters file can then be edited to point to the new
subtracted particles.mrcs stack. If required, the new particle stack
and the subtracted 3D reference can be down-sampled to a coarser
pixel size for computational speedup. Also, the user should set the
nclasses parameter to the number of classes desired. In order to run
the 3D classification, the user should start immediately after the
refinement cycle in which the consensus refinement converged
(e.g., 10, if the auto-refinement converged in cycle 9). Because
the signal-subtracted particles may contain too little signal for
reliable alignments, it is recommended to disable the optimization
of any alignment parameters at this stage and run the classification
for a pre-defined number of cycles (e.g., 40). In this case, the autorefiner will not be used and the 3D classification can be launched
with the command frealign_run_refine. The occupancies of the
particles in each class will be randomized to initialize the classification. Convergence of the 3D classification can be assessed by the
user with the frealign_calc_stats.
3.7 Assessing
Resolution
and Post-Processing
Resolution is typically assessed by computing the FSC curves
[54, 55] between independently (beyond a certain resolution)
refined half-maps. As explained in Subheading 3.3.3, FOCUS
ensures that particles from the same 2D crystal are assigned to the
Fig. 4 Signal subtraction for 3D classification. For 2D crystal data, the projection of the neighboring proteins
(transparent yellow densities) overlap with the projection of the classification target (red density) in the tilted
views. In order to perform 3D classification, it is necessary to subtract the signal of the neighboring proteins
from the particles. Shown here is an example from the MloK1 dataset. Scale bar: 50 A ˚
Single Particle Analysis for High-Resolution 2D Electron Crystallography
279