

for electron crystallographic data collection, the electron dose is
limited to about 10 e
À /A
2 or less [11, 42] in comparison to 30 e
À /
A ˚ 2 for typical single-particle cryo-EM imaging. On the other hand,
the choice of using electron diffraction or imaging depends on the
crystal quality and the target resolution of the reconstruction.
Electron diffraction is usually the option when the 2D crystal is
well ordered and large (in the μm size range). With diffraction, the
intensities, and therefore the amplitudes, of the reflections are more
accurately measured because they are not modulated by the contrast transfer function (CTF) of the TEM. However, with diffraction the initial phases for the map reconstruction will need to be
determined separately. On the other hand, imaging on a 2D crystal
provides both the amplitudes and phases of the structural factor
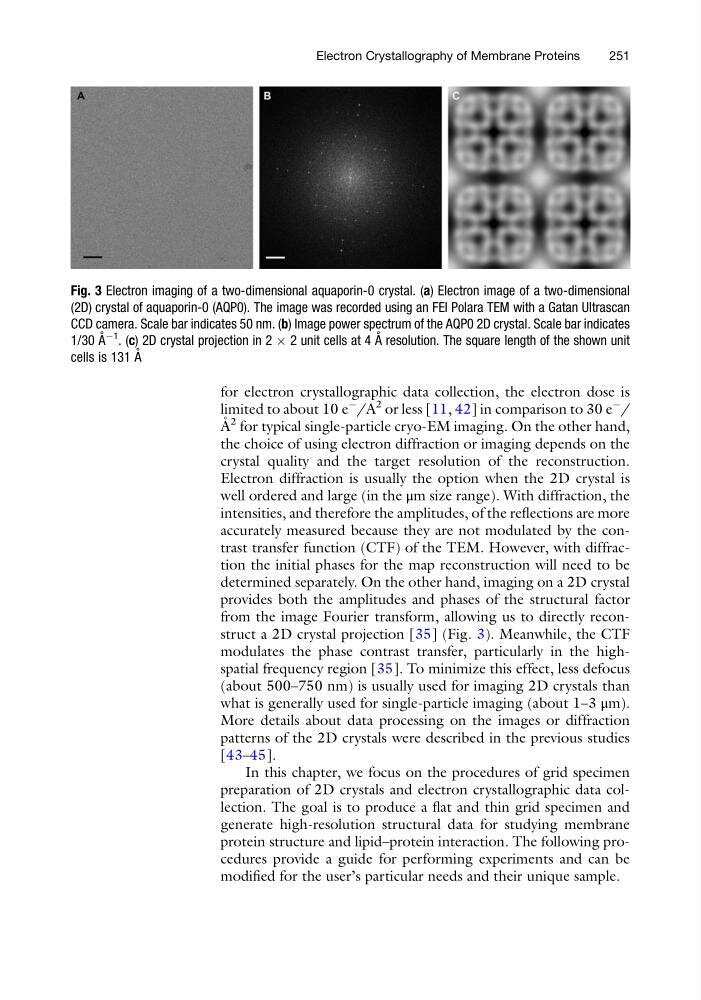
from the image Fourier transform, allowing us to directly reconstruct a 2D crystal projection [35] (Fig. 3). Meanwhile, the CTF
modulates the phase contrast transfer, particularly in the highspatial frequency region [35]. To minimize this effect, less defocus
(about 500–750 nm) is usually used for imaging 2D crystals than
what is generally used for single-particle imaging (about 1–3 μm).
More details about data processing on the images or diffraction
patterns of the 2D crystals were described in the previous studies
[43–45].
In this chapter, we focus on the procedures of grid specimen
preparation of 2D crystals and electron crystallographic data collection. The goal is to produce a flat and thin grid specimen and
generate high-resolution structural data for studying membrane
protein structure and lipid–protein interaction. The following procedures provide a guide for performing experiments and can be
modified for the user’s particular needs and their unique sample.
Fig. 3 Electron imaging of a two-dimensional aquaporin-0 crystal. (a) Electron image of a two-dimensional
(2D) crystal of aquaporin-0 (AQP0). The image was recorded using an FEI Polara TEM with a Gatan Ultrascan
CCD camera. Scale bar indicates 50 nm. (b) Image power spectrum of the AQP0 2D crystal. Scale bar indicates
1/30 A ˚ À1 . (c) 2D crystal projection in 2 Â 2 unit cells at 4 A ˚ resolution. The square length of the shown unit
cells is 131 A ˚
Electron Crystallography of Membrane Proteins
251
limited to about 10 e
À /A
2 or less [11, 42] in comparison to 30 e
À /
A ˚ 2 for typical single-particle cryo-EM imaging. On the other hand,
the choice of using electron diffraction or imaging depends on the
crystal quality and the target resolution of the reconstruction.
Electron diffraction is usually the option when the 2D crystal is
well ordered and large (in the μm size range). With diffraction, the
intensities, and therefore the amplitudes, of the reflections are more
accurately measured because they are not modulated by the contrast transfer function (CTF) of the TEM. However, with diffraction the initial phases for the map reconstruction will need to be
determined separately. On the other hand, imaging on a 2D crystal
provides both the amplitudes and phases of the structural factor
from the image Fourier transform, allowing us to directly reconstruct a 2D crystal projection [35] (Fig. 3). Meanwhile, the CTF
modulates the phase contrast transfer, particularly in the highspatial frequency region [35]. To minimize this effect, less defocus
(about 500–750 nm) is usually used for imaging 2D crystals than
what is generally used for single-particle imaging (about 1–3 μm).
More details about data processing on the images or diffraction
patterns of the 2D crystals were described in the previous studies
[43–45].
In this chapter, we focus on the procedures of grid specimen
preparation of 2D crystals and electron crystallographic data collection. The goal is to produce a flat and thin grid specimen and
generate high-resolution structural data for studying membrane
protein structure and lipid–protein interaction. The following procedures provide a guide for performing experiments and can be
modified for the user’s particular needs and their unique sample.
Fig. 3 Electron imaging of a two-dimensional aquaporin-0 crystal. (a) Electron image of a two-dimensional
(2D) crystal of aquaporin-0 (AQP0). The image was recorded using an FEI Polara TEM with a Gatan Ultrascan
CCD camera. Scale bar indicates 50 nm. (b) Image power spectrum of the AQP0 2D crystal. Scale bar indicates
1/30 A ˚ À1 . (c) 2D crystal projection in 2 Â 2 unit cells at 4 A ˚ resolution. The square length of the shown unit
cells is 131 A ˚
Electron Crystallography of Membrane Proteins
251