

map. The position of the ligand corresponded well with the difference map density as well as biochemical mutation data of residues
surrounding the binding site [55].
3.7 Model Validation
After a model has been obtained, for example using the tools
described above, it is necessary to assess its quality, by identifying
if its overall fit to the data is reasonable, and if the geometry of the
model is chemically possible. Global assessment is useful to provide
an overall picture of the model quality and allows for automated
sorting, ranking, and filtering of models. Local assessment allows to
pinpoint potential modeling errors, which may lead to further
refinement. Both type of tools will be presented in this section.
While some tools and methods can be used either at the validation or modeling stage, it is good practice not to use the same for
both: scoring and assessment methods may have blind spots in their
ability to assess model quality, and a model refined to have a high
quality in one may yet be low scoring in another. This would not be
easily uncovered unless different methods are used.
3.7.1 Assessing Global
Quality
Map Assessment
The cross-correlation remains the most common assessment tool
for map-to-map quality and can easily be extended to model-tomap assessment by blurring the structure (see Subheading 2.2).
This is widely implemented in EM packages and is the de facto
standard (often in conjunction with masking or filtering, see
Note 2). The FSC (Fourier Shell Correlation) is the other common
measure for map quality. It quantifies the degree to which the real
part of the Fourier components of two maps are correlated and is
used to estimate the resolution of a density map, by finding the
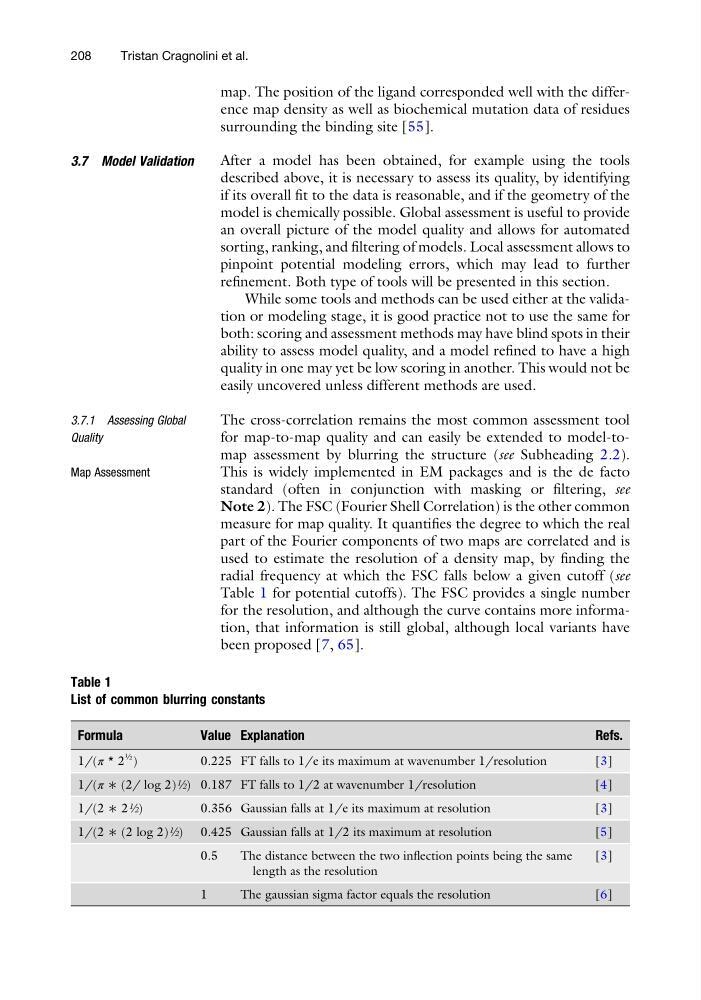
radial frequency at which the FSC falls below a given cutoff (see
Table 1 for potential cutoffs). The FSC provides a single number
for the resolution, and although the curve contains more information, that information is still global, although local variants have
been proposed [7, 65].
Table 1
List of common blurring constants
Formula
Value Explanation
Refs.
1/(π * 2
½ )
0.225 FT falls to 1/e its maximum at wavenumber 1/resolution
[3]
1/(π ∗ (2/ log 2)½) 0.187 FT falls to 1/2 at wavenumber 1/resolution
[4]
1/(2 ∗ 2½)
0.356 Gaussian falls at 1/e its maximum at resolution
[3]
1/(2 ∗ (2 log 2)½) 0.425 Gaussian falls at 1/2 its maximum at resolution
[5]
0.5
The distance between the two inflection points being the same
length as the resolution
[3]
1
The gaussian sigma factor equals the resolution
[6]
208
Tristan Cragnolini et al.
surrounding the binding site [55].
3.7 Model Validation
After a model has been obtained, for example using the tools
described above, it is necessary to assess its quality, by identifying
if its overall fit to the data is reasonable, and if the geometry of the
model is chemically possible. Global assessment is useful to provide
an overall picture of the model quality and allows for automated
sorting, ranking, and filtering of models. Local assessment allows to
pinpoint potential modeling errors, which may lead to further
refinement. Both type of tools will be presented in this section.
While some tools and methods can be used either at the validation or modeling stage, it is good practice not to use the same for
both: scoring and assessment methods may have blind spots in their
ability to assess model quality, and a model refined to have a high
quality in one may yet be low scoring in another. This would not be
easily uncovered unless different methods are used.
3.7.1 Assessing Global
Quality
Map Assessment
The cross-correlation remains the most common assessment tool
for map-to-map quality and can easily be extended to model-tomap assessment by blurring the structure (see Subheading 2.2).
This is widely implemented in EM packages and is the de facto
standard (often in conjunction with masking or filtering, see
Note 2). The FSC (Fourier Shell Correlation) is the other common
measure for map quality. It quantifies the degree to which the real
part of the Fourier components of two maps are correlated and is
used to estimate the resolution of a density map, by finding the
radial frequency at which the FSC falls below a given cutoff (see
Table 1 for potential cutoffs). The FSC provides a single number
for the resolution, and although the curve contains more information, that information is still global, although local variants have
been proposed [7, 65].
Table 1
List of common blurring constants
Formula
Value Explanation
Refs.
1/(π * 2
½ )
0.225 FT falls to 1/e its maximum at wavenumber 1/resolution
[3]
1/(π ∗ (2/ log 2)½) 0.187 FT falls to 1/2 at wavenumber 1/resolution
[4]
1/(2 ∗ 2½)
0.356 Gaussian falls at 1/e its maximum at resolution
[3]
1/(2 ∗ (2 log 2)½) 0.425 Gaussian falls at 1/2 its maximum at resolution
[5]
0.5
The distance between the two inflection points being the same
length as the resolution
[3]
1
The gaussian sigma factor equals the resolution
[6]
208
Tristan Cragnolini et al.