

including accurate map-map alignment, structural blurring of one
map to the lower of the two resolutions, and scaling of the amplitudes between maps.
One case where volume data and difference mapping was
exploited to identify the density corresponding to a ligand was for
the Kinesin-8 (Kif18A) specific inhibitor BTB-1 [55, 64]. The
authors report three density maps for tubulin-bound kinesin, representing three states of kinesin in either the ANP-PNP (Phosphoaminophosphonic acid-adenylate ester; A non-hydrolyzable ATP
analog) bound state, the no-nucleotide state or the BTB-1-bound
state (EMD:3780, 3778, 3803; PDB: 5ocu, 5oam, 5ogc, respectively). A difference map was created between the BTB-1-bound
kinesin map and the no-nucleotide state, utilizing the difference
mapping methodology in TEMPy [17]. The difference density
corresponded to areas of conformational change in the vicinity of
the nucleotide-binding pocket but it also included a prominent
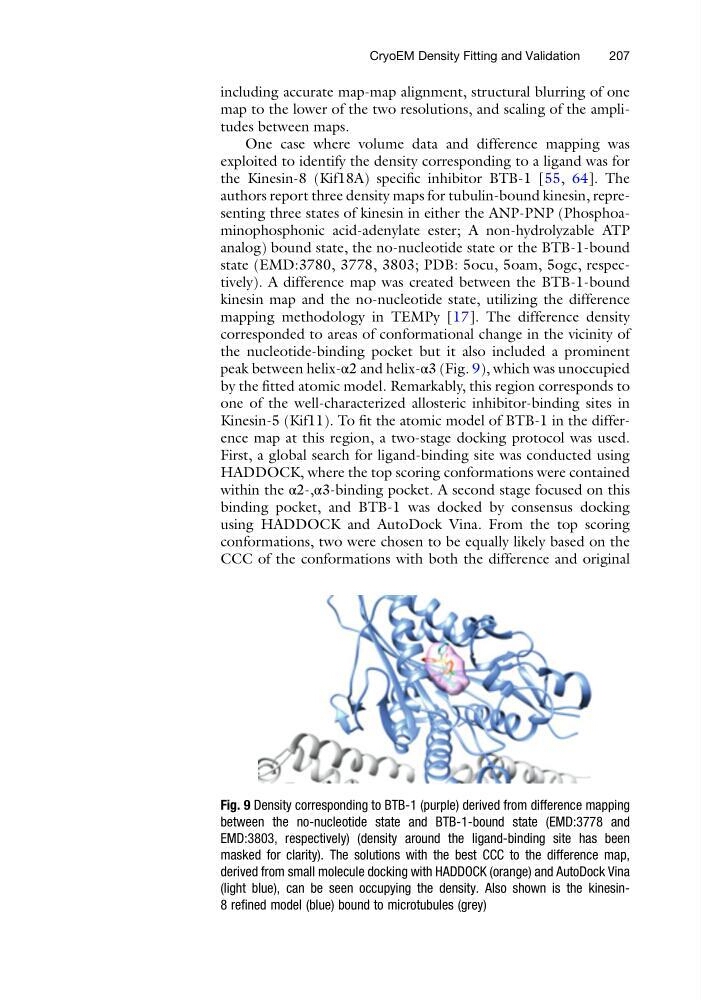
peak between helix-α2 and helix-α3 (Fig. 9), which was unoccupied
by the fitted atomic model. Remarkably, this region corresponds to
one of the well-characterized allosteric inhibitor-binding sites in
Kinesin-5 (Kif11). To fit the atomic model of BTB-1 in the difference map at this region, a two-stage docking protocol was used.
First, a global search for ligand-binding site was conducted using
HADDOCK, where the top scoring conformations were contained
within the α2-,α3-binding pocket. A second stage focused on this
binding pocket, and BTB-1 was docked by consensus docking
using HADDOCK and AutoDock Vina. From the top scoring
conformations, two were chosen to be equally likely based on the
CCC of the conformations with both the difference and original
Fig. 9 Density corresponding to BTB-1 (purple) derived from difference mapping
between the no-nucleotide state and BTB-1-bound state (EMD:3778 and
EMD:3803, respectively) (density around the ligand-binding site has been
masked for clarity). The solutions with the best CCC to the difference map,
derived from small molecule docking with HADDOCK (orange) and AutoDock Vina
(light blue), can be seen occupying the density. Also shown is the kinesin8 refined model (blue) bound to microtubules (grey)
CryoEM Density Fitting and Validation
207
map to the lower of the two resolutions, and scaling of the amplitudes between maps.
One case where volume data and difference mapping was
exploited to identify the density corresponding to a ligand was for
the Kinesin-8 (Kif18A) specific inhibitor BTB-1 [55, 64]. The
authors report three density maps for tubulin-bound kinesin, representing three states of kinesin in either the ANP-PNP (Phosphoaminophosphonic acid-adenylate ester; A non-hydrolyzable ATP
analog) bound state, the no-nucleotide state or the BTB-1-bound
state (EMD:3780, 3778, 3803; PDB: 5ocu, 5oam, 5ogc, respectively). A difference map was created between the BTB-1-bound
kinesin map and the no-nucleotide state, utilizing the difference
mapping methodology in TEMPy [17]. The difference density
corresponded to areas of conformational change in the vicinity of
the nucleotide-binding pocket but it also included a prominent
peak between helix-α2 and helix-α3 (Fig. 9), which was unoccupied
by the fitted atomic model. Remarkably, this region corresponds to
one of the well-characterized allosteric inhibitor-binding sites in
Kinesin-5 (Kif11). To fit the atomic model of BTB-1 in the difference map at this region, a two-stage docking protocol was used.
First, a global search for ligand-binding site was conducted using
HADDOCK, where the top scoring conformations were contained
within the α2-,α3-binding pocket. A second stage focused on this
binding pocket, and BTB-1 was docked by consensus docking
using HADDOCK and AutoDock Vina. From the top scoring
conformations, two were chosen to be equally likely based on the
CCC of the conformations with both the difference and original
Fig. 9 Density corresponding to BTB-1 (purple) derived from difference mapping
between the no-nucleotide state and BTB-1-bound state (EMD:3778 and
EMD:3803, respectively) (density around the ligand-binding site has been
masked for clarity). The solutions with the best CCC to the difference map,
derived from small molecule docking with HADDOCK (orange) and AutoDock Vina
(light blue), can be seen occupying the density. Also shown is the kinesin8 refined model (blue) bound to microtubules (grey)
CryoEM Density Fitting and Validation
207