

Main view
Half-map
Map-to-model
Main view
Half-map
Map-to-model
Rotate x by 90°
Rotate x by 90°
Half-map
Map-to-model
Half-map
Map-to-model
Rotate y by 90°
Rotate y by 90°
Half-map
Map-to-model
0.00
0.15
0.28
0.41
0.54
0.00
0.09
0.17
0.24
0.32
Spatial
frequency (1/Å)
Spatial
frequency (1/Å)
Half-map
Map-to-model
0°
a
b
40°
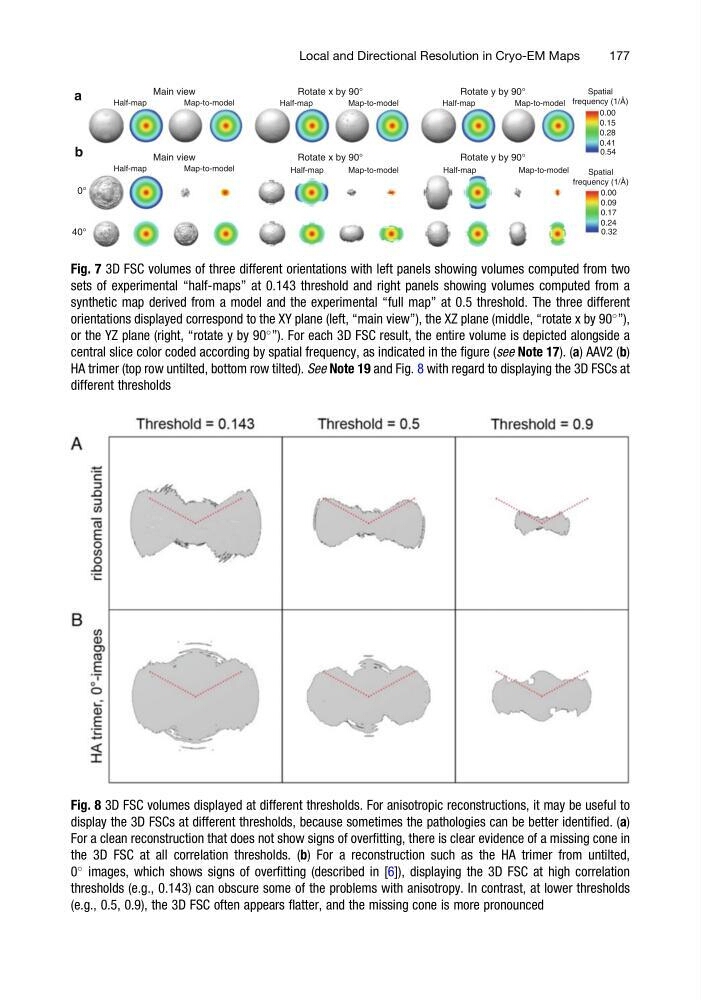
Fig. 7 3D FSC volumes of three different orientations with left panels showing volumes computed from two
sets of experimental “half-maps” at 0.143 threshold and right panels showing volumes computed from a
synthetic map derived from a model and the experimental “full map” at 0.5 threshold. The three different
orientations displayed correspond to the XY plane (left, “main view”), the XZ plane (middle, “rotate x by 90
”),
or the YZ plane (right, “rotate y by 90
”). For each 3D FSC result, the entire volume is depicted alongside a
central slice color coded according by spatial frequency, as indicated in the figure (see Note 17). (a) AAV2 (b)
HA trimer (top row untilted, bottom row tilted). See Note 19 and Fig. 8 with regard to displaying the 3D FSCs at
different thresholds
Fig. 8 3D FSC volumes displayed at different thresholds. For anisotropic reconstructions, it may be useful to
display the 3D FSCs at different thresholds, because sometimes the pathologies can be better identified. (a)
For a clean reconstruction that does not show signs of overfitting, there is clear evidence of a missing cone in
the 3D FSC at all correlation thresholds. (b) For a reconstruction such as the HA trimer from untilted,
0
images, which shows signs of overfitting (described in [6]), displaying the 3D FSC at high correlation
thresholds (e.g., 0.143) can obscure some of the problems with anisotropy. In contrast, at lower thresholds
(e.g., 0.5, 0.9), the 3D FSC often appears flatter, and the missing cone is more pronounced
Local and Directional Resolution in Cryo-EM Maps
177
Half-map
Map-to-model
Main view
Half-map
Map-to-model
Rotate x by 90°
Rotate x by 90°
Half-map
Map-to-model
Half-map
Map-to-model
Rotate y by 90°
Rotate y by 90°
Half-map
Map-to-model
0.00
0.15
0.28
0.41
0.54
0.00
0.09
0.17
0.24
0.32
Spatial
frequency (1/Å)
Spatial
frequency (1/Å)
Half-map
Map-to-model
0°
a
b
40°
Fig. 7 3D FSC volumes of three different orientations with left panels showing volumes computed from two
sets of experimental “half-maps” at 0.143 threshold and right panels showing volumes computed from a
synthetic map derived from a model and the experimental “full map” at 0.5 threshold. The three different
orientations displayed correspond to the XY plane (left, “main view”), the XZ plane (middle, “rotate x by 90
”),
or the YZ plane (right, “rotate y by 90
”). For each 3D FSC result, the entire volume is depicted alongside a
central slice color coded according by spatial frequency, as indicated in the figure (see Note 17). (a) AAV2 (b)
HA trimer (top row untilted, bottom row tilted). See Note 19 and Fig. 8 with regard to displaying the 3D FSCs at
different thresholds
Fig. 8 3D FSC volumes displayed at different thresholds. For anisotropic reconstructions, it may be useful to
display the 3D FSCs at different thresholds, because sometimes the pathologies can be better identified. (a)
For a clean reconstruction that does not show signs of overfitting, there is clear evidence of a missing cone in
the 3D FSC at all correlation thresholds. (b) For a reconstruction such as the HA trimer from untilted,
0
images, which shows signs of overfitting (described in [6]), displaying the 3D FSC at high correlation
thresholds (e.g., 0.143) can obscure some of the problems with anisotropy. In contrast, at lower thresholds
(e.g., 0.5, 0.9), the 3D FSC often appears flatter, and the missing cone is more pronounced
Local and Directional Resolution in Cryo-EM Maps
177