

map-model analysis (the model, here, is an external reference standard that is expected to be isotropic, see Note 20), the 3D FSC
describing the reconstruction from untilted images is severely flattened relative to the 3D FSC describing the reconstruction from
tilted images. Because we are using an external standard for the
analysis, this is likely a more realistic representation of the true
directional resolution (see Notes 20 and 21).
3.3.4 Interpreting
the Experimental Map
The presence of icosahedral symmetry fills in all directional views
and expectedly results in a high-quality map for AAV2 capsid,
where the interpretation of the map and derivation of the
subsequent model is not hampered by anisotropy artifacts (see
Fig. 9a). Viewing the map along three different planes shows
uniform map features. In contrast, an anisotropic map will show
artifactual densities in the direction parallel to preferred
φ = 90°
φ = 135°
φ = 180°
φ = 225°
φ = 270°
θ = 30°
θ = 60°
340+
0
φ = 90°
φ = 135°
φ = 180°
φ = 225°
φ = 270°
θ = 30°
θ = 60°
1354+
0
φ = 90°
φ = 135°
φ = 180°
φ = 225°
φ = 270°
θ = 30°
θ = 60°
1354+
0
a
b
c
φ = 315°
φ = 0°
φ = 45°
φ = 315°
φ = 0°
φ = 45°
φ = 315°
φ = 0°
φ = 45°
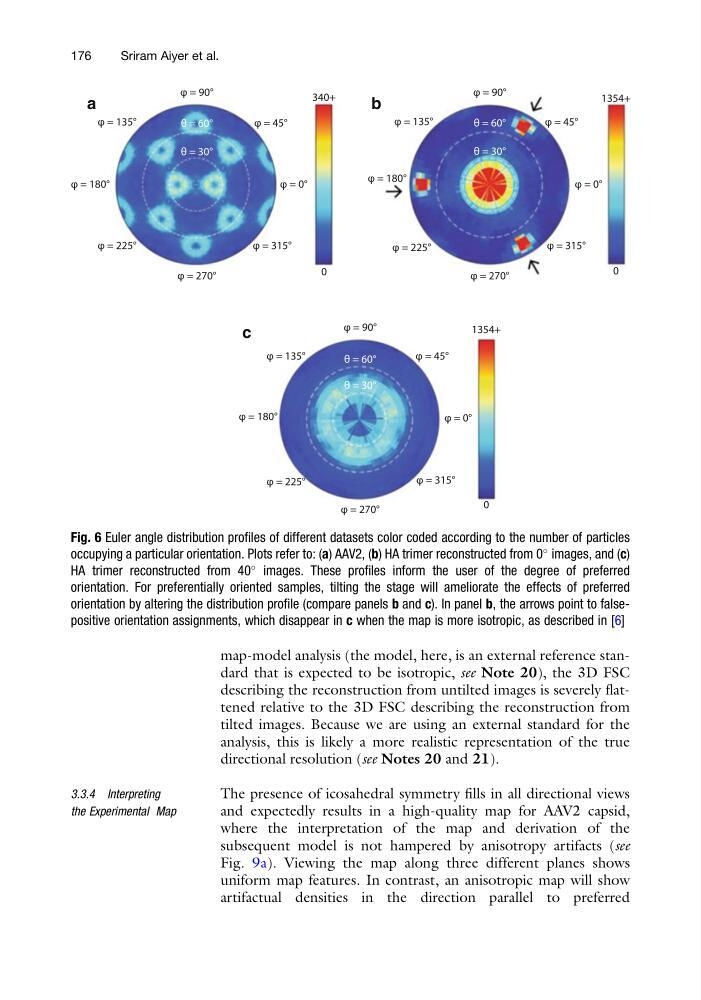
Fig. 6 Euler angle distribution profiles of different datasets color coded according to the number of particles
occupying a particular orientation. Plots refer to: (a) AAV2, (b) HA trimer reconstructed from 0
images, and (c)
HA trimer reconstructed from 40
images. These profiles inform the user of the degree of preferred
orientation. For preferentially oriented samples, tilting the stage will ameliorate the effects of preferred
orientation by altering the distribution profile (compare panels b and c). In panel b, the arrows point to falsepositive orientation assignments, which disappear in c when the map is more isotropic, as described in [6]
176
Sriram Aiyer et al.
describing the reconstruction from untilted images is severely flattened relative to the 3D FSC describing the reconstruction from
tilted images. Because we are using an external standard for the
analysis, this is likely a more realistic representation of the true
directional resolution (see Notes 20 and 21).
3.3.4 Interpreting
the Experimental Map
The presence of icosahedral symmetry fills in all directional views
and expectedly results in a high-quality map for AAV2 capsid,
where the interpretation of the map and derivation of the
subsequent model is not hampered by anisotropy artifacts (see
Fig. 9a). Viewing the map along three different planes shows
uniform map features. In contrast, an anisotropic map will show
artifactual densities in the direction parallel to preferred
φ = 90°
φ = 135°
φ = 180°
φ = 225°
φ = 270°
θ = 30°
θ = 60°
340+
0
φ = 90°
φ = 135°
φ = 180°
φ = 225°
φ = 270°
θ = 30°
θ = 60°
1354+
0
φ = 90°
φ = 135°
φ = 180°
φ = 225°
φ = 270°
θ = 30°
θ = 60°
1354+
0
a
b
c
φ = 315°
φ = 0°
φ = 45°
φ = 315°
φ = 0°
φ = 45°
φ = 315°
φ = 0°
φ = 45°
Fig. 6 Euler angle distribution profiles of different datasets color coded according to the number of particles
occupying a particular orientation. Plots refer to: (a) AAV2, (b) HA trimer reconstructed from 0
images, and (c)
HA trimer reconstructed from 40
images. These profiles inform the user of the degree of preferred
orientation. For preferentially oriented samples, tilting the stage will ameliorate the effects of preferred
orientation by altering the distribution profile (compare panels b and c). In panel b, the arrows point to falsepositive orientation assignments, which disappear in c when the map is more isotropic, as described in [6]
176
Sriram Aiyer et al.