

6. Color the 3D FSC by spatial frequency and calculate the resolution in different directions. Once you have the 3D FSC
opened in Chimera, check the voxel size of the volume. It
should be expressed in Å
À1 and therefore should be 1/(voxel
size) of your data (see Note 17). The Chimera script in step 5
automatically sets the origin of the 3D FSC to be at the center
of the box. If you open it by hand, you may have to set the
origin manually (e.g., volume #0 origin Index 256, 256,
256 for a 3D FSC with a box size of 512). Go to the “Tools”
tab in “Volume Viewer” and select the “Surface Color” panel.
Use the following settings to color the 3D FSC volume by
resolution:
l
Color Surface: your_3dfsc_map.mrc
l
By: Radius
The “Surface Color” panel also lets you set the origin, if
you did not do this in the previous step. Press the “set” button
to set the full range of surface values and make sure the “report
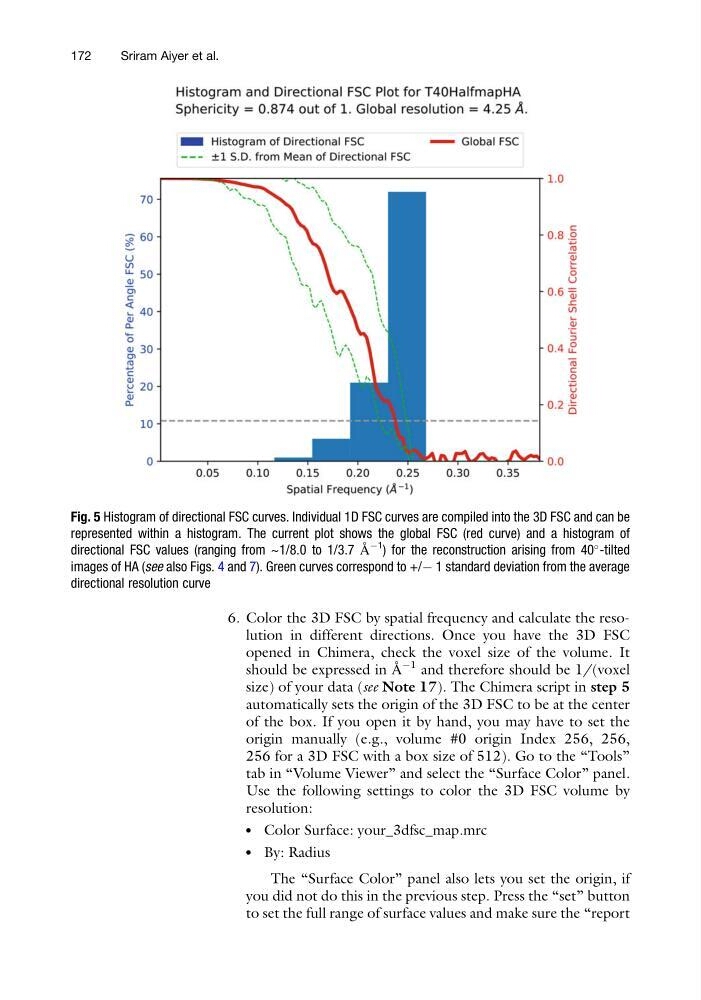
Fig. 5 Histogram of directional FSC curves. Individual 1D FSC curves are compiled into the 3D FSC and can be
represented within a histogram. The current plot shows the global FSC (red curve) and a histogram of
directional FSC values (ranging from ~1/8.0 to 1/3.7 Å
À1
) for the reconstruction arising from 40
-tilted
images of HA (see also Figs. 4 and 7). Green curves correspond to +/À 1 standard deviation from the average
directional resolution curve
172
Sriram Aiyer et al.
opened in Chimera, check the voxel size of the volume. It
should be expressed in Å
À1 and therefore should be 1/(voxel
size) of your data (see Note 17). The Chimera script in step 5
automatically sets the origin of the 3D FSC to be at the center
of the box. If you open it by hand, you may have to set the
origin manually (e.g., volume #0 origin Index 256, 256,
256 for a 3D FSC with a box size of 512). Go to the “Tools”
tab in “Volume Viewer” and select the “Surface Color” panel.
Use the following settings to color the 3D FSC volume by
resolution:
l
Color Surface: your_3dfsc_map.mrc
l
By: Radius
The “Surface Color” panel also lets you set the origin, if
you did not do this in the previous step. Press the “set” button
to set the full range of surface values and make sure the “report
Fig. 5 Histogram of directional FSC curves. Individual 1D FSC curves are compiled into the 3D FSC and can be
represented within a histogram. The current plot shows the global FSC (red curve) and a histogram of
directional FSC values (ranging from ~1/8.0 to 1/3.7 Å
À1
) for the reconstruction arising from 40
-tilted
images of HA (see also Figs. 4 and 7). Green curves correspond to +/À 1 standard deviation from the average
directional resolution curve
172
Sriram Aiyer et al.