

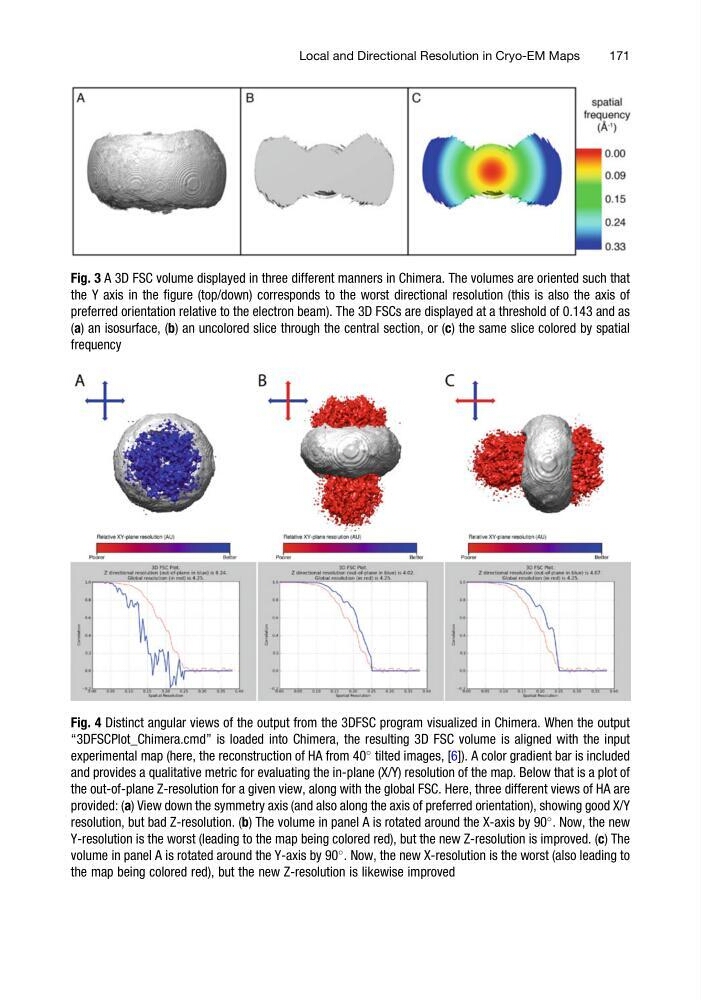
Fig. 3 A 3D FSC volume displayed in three different manners in Chimera. The volumes are oriented such that
the Y axis in the figure (top/down) corresponds to the worst directional resolution (this is also the axis of
preferred orientation relative to the electron beam). The 3D FSCs are displayed at a threshold of 0.143 and as
(a) an isosurface, (b) an uncolored slice through the central section, or (c) the same slice colored by spatial
frequency
Fig. 4 Distinct angular views of the output from the 3DFSC program visualized in Chimera. When the output
“3DFSCPlot_Chimera.cmd” is loaded into Chimera, the resulting 3D FSC volume is aligned with the input
experimental map (here, the reconstruction of HA from 40
tilted images, [6]). A color gradient bar is included
and provides a qualitative metric for evaluating the in-plane (X/Y) resolution of the map. Below that is a plot of
the out-of-plane Z-resolution for a given view, along with the global FSC. Here, three different views of HA are
provided: (a) View down the symmetry axis (and also along the axis of preferred orientation), showing good X/Y
resolution, but bad Z-resolution. (b) The volume in panel A is rotated around the X-axis by 90
. Now, the new
Y-resolution is the worst (leading to the map being colored red), but the new Z-resolution is improved. (c) The
volume in panel A is rotated around the Y-axis by 90
. Now, the new X-resolution is the worst (also leading to
the map being colored red), but the new Z-resolution is likewise improved
Local and Directional Resolution in Cryo-EM Maps
171
the Y axis in the figure (top/down) corresponds to the worst directional resolution (this is also the axis of
preferred orientation relative to the electron beam). The 3D FSCs are displayed at a threshold of 0.143 and as
(a) an isosurface, (b) an uncolored slice through the central section, or (c) the same slice colored by spatial
frequency
Fig. 4 Distinct angular views of the output from the 3DFSC program visualized in Chimera. When the output
“3DFSCPlot_Chimera.cmd” is loaded into Chimera, the resulting 3D FSC volume is aligned with the input
experimental map (here, the reconstruction of HA from 40
tilted images, [6]). A color gradient bar is included
and provides a qualitative metric for evaluating the in-plane (X/Y) resolution of the map. Below that is a plot of
the out-of-plane Z-resolution for a given view, along with the global FSC. Here, three different views of HA are
provided: (a) View down the symmetry axis (and also along the axis of preferred orientation), showing good X/Y
resolution, but bad Z-resolution. (b) The volume in panel A is rotated around the X-axis by 90
. Now, the new
Y-resolution is the worst (leading to the map being colored red), but the new Z-resolution is improved. (c) The
volume in panel A is rotated around the Y-axis by 90
. Now, the new X-resolution is the worst (also leading to
the map being colored red), but the new Z-resolution is likewise improved
Local and Directional Resolution in Cryo-EM Maps
171