

simple heuristics developed in response to repeated exposure to social clichés) that
drove the students’ answers. This one factor detected in the reduced SFC explains
only 24.6% of the entire variation in data, with high uniqueness being found for each
of the items as presented in Table (10.3).
In terms of confirmatory factor analysis, we found that the performance of the
model express through the goodness of fit values presented in Table (10.4) is pretty
decent, considering the lack of similar content displayed by the remained items.
To summarize, the SFC scale applied to this sample does not reveal any of the
dimensions revealed in the original study, and we have reasons to admit that much of
the consistency of the reduced SFC comes from clichés and socially desirable
answers, rather from students’ awareness regarding their food consumption
behavior.
C14
C9
C2
C1
C12
C11
C10
C13
C15
C5
C4
C8
C6
C7
1
0
0.8
0.6
0.4
0.2
-0.2
-0.4
-0.6
-0.8
-1
C3
C14
C9
C2
C1
C12
C11
C10
C13
C15
C5
C4
C8
C6
C7
C3
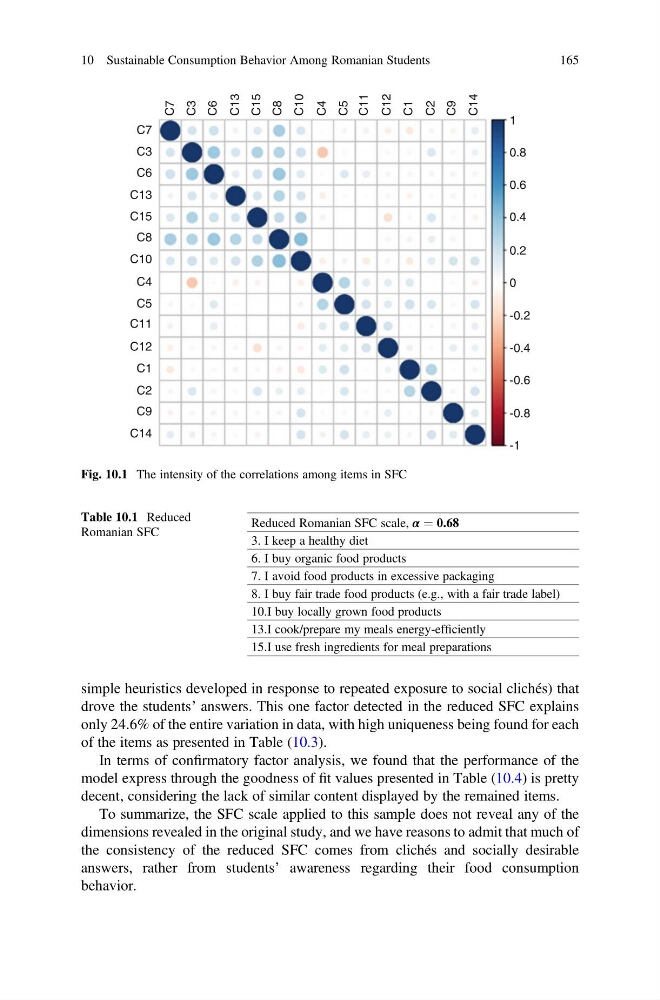
Fig. 10.1 The intensity of the correlations among items in SFC
Table 10.1 Reduced
Romanian SFC
Reduced Romanian SFC scale, α ¼ 0.68
3. I keep a healthy diet
6. I buy organic food products
7. I avoid food products in excessive packaging
8. I buy fair trade food products (e.g., with a fair trade label)
10.I buy locally grown food products
13.I cook/prepare my meals energy-efficiently
15.I use fresh ingredients for meal preparations
10 Sustainable Consumption Behavior Among Romanian Students
165
drove the students’ answers. This one factor detected in the reduced SFC explains
only 24.6% of the entire variation in data, with high uniqueness being found for each
of the items as presented in Table (10.3).
In terms of confirmatory factor analysis, we found that the performance of the
model express through the goodness of fit values presented in Table (10.4) is pretty
decent, considering the lack of similar content displayed by the remained items.
To summarize, the SFC scale applied to this sample does not reveal any of the
dimensions revealed in the original study, and we have reasons to admit that much of
the consistency of the reduced SFC comes from clichés and socially desirable
answers, rather from students’ awareness regarding their food consumption
behavior.
C14
C9
C2
C1
C12
C11
C10
C13
C15
C5
C4
C8
C6
C7
1
0
0.8
0.6
0.4
0.2
-0.2
-0.4
-0.6
-0.8
-1
C3
C14
C9
C2
C1
C12
C11
C10
C13
C15
C5
C4
C8
C6
C7
C3
Fig. 10.1 The intensity of the correlations among items in SFC
Table 10.1 Reduced
Romanian SFC
Reduced Romanian SFC scale, α ¼ 0.68
3. I keep a healthy diet
6. I buy organic food products
7. I avoid food products in excessive packaging
8. I buy fair trade food products (e.g., with a fair trade label)
10.I buy locally grown food products
13.I cook/prepare my meals energy-efficiently
15.I use fresh ingredients for meal preparations
10 Sustainable Consumption Behavior Among Romanian Students
165