

by large-scale atmospheric circulation drivers, particularly the El Niño-Southern
Oscillation, leading to high variability and the occurrence of droughts and floods
(CSIRO 2012). On the eastern Australian coast (Queensland and down into New
South Wales), the formation of ‘east coast lows’ can also have a significant impact
on water resources, resulting in intermittent large inflows into water catchments.
This area has also been subject to considerable climate variability, including the
Millennium Drought and the two wettest years on record for Australia (2010–2011)
as a result of two strong La Niña events (CSIRO 2012). Queensland is the most
natural disaster-prone state in Australia (ABS 2012b; Davis 2016). With an increasingly variable climate, impacts to agriculture will manifest, particularly in the
frequency and intensity of extreme weather events ranging from longer dryer
periods, intense flooding, fewer frosts and warmer temperatures for longer and
increased maximums (WWF 2015). These events pose increased risks to soils in
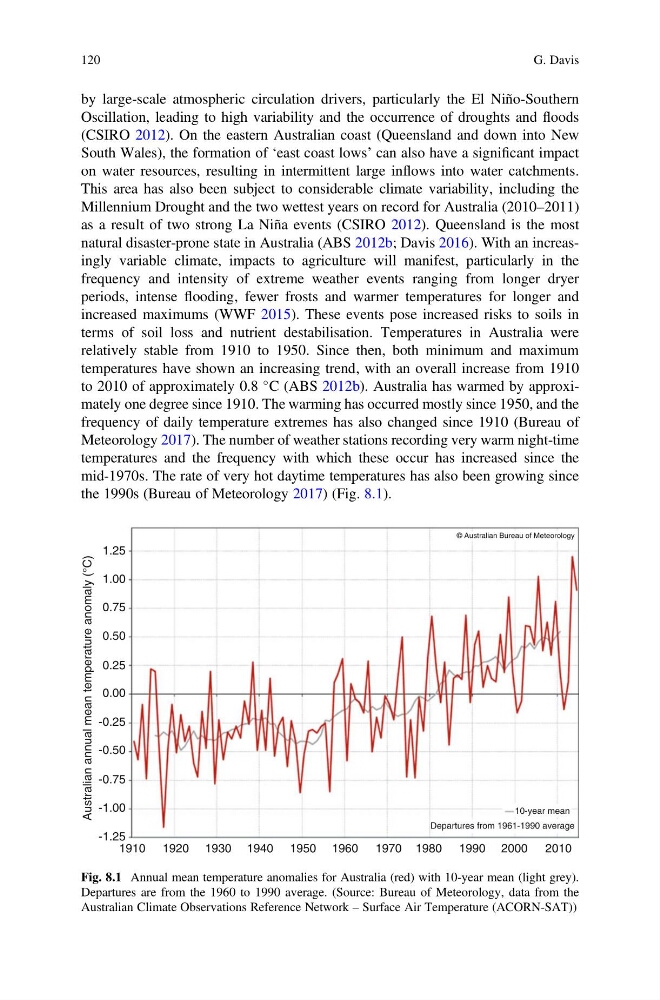
terms of soil loss and nutrient destabilisation. Temperatures in Australia were
relatively stable from 1910 to 1950. Since then, both minimum and maximum
temperatures have shown an increasing trend, with an overall increase from 1910
to 2010 of approximately 0.8
C (ABS 2012b). Australia has warmed by approximately one degree since 1910. The warming has occurred mostly since 1950, and the
frequency of daily temperature extremes has also changed since 1910 (Bureau of
Meteorology 2017). The number of weather stations recording very warm night-time
temperatures and the frequency with which these occur has increased since the
mid-1970s. The rate of very hot daytime temperatures has also been growing since
the 1990s (Bureau of Meteorology 2017) (Fig. 8.1).
1.25
Australian annual mean temperature anomaly (°C)
1.00
0.75
0.50
0.25
-0.25
-0.50
-0.75
-1.00
-1.25
1910 1920 1930 1940 1950 1960 1970 1980 1990 2000 2010
10-year mean
© Australian Bureau of Meteorology
Departures from 1961-1990 average
0.00
Fig. 8.1 Annual mean temperature anomalies for Australia (red) with 10-year mean (light grey).
Departures are from the 1960 to 1990 average. (Source: Bureau of Meteorology, data from the
Australian Climate Observations Reference Network – Surface Air Temperature (ACORN-SAT))
120
G. Davis
Oscillation, leading to high variability and the occurrence of droughts and floods
(CSIRO 2012). On the eastern Australian coast (Queensland and down into New
South Wales), the formation of ‘east coast lows’ can also have a significant impact
on water resources, resulting in intermittent large inflows into water catchments.
This area has also been subject to considerable climate variability, including the
Millennium Drought and the two wettest years on record for Australia (2010–2011)
as a result of two strong La Niña events (CSIRO 2012). Queensland is the most
natural disaster-prone state in Australia (ABS 2012b; Davis 2016). With an increasingly variable climate, impacts to agriculture will manifest, particularly in the
frequency and intensity of extreme weather events ranging from longer dryer
periods, intense flooding, fewer frosts and warmer temperatures for longer and
increased maximums (WWF 2015). These events pose increased risks to soils in
terms of soil loss and nutrient destabilisation. Temperatures in Australia were
relatively stable from 1910 to 1950. Since then, both minimum and maximum
temperatures have shown an increasing trend, with an overall increase from 1910
to 2010 of approximately 0.8
C (ABS 2012b). Australia has warmed by approximately one degree since 1910. The warming has occurred mostly since 1950, and the
frequency of daily temperature extremes has also changed since 1910 (Bureau of
Meteorology 2017). The number of weather stations recording very warm night-time
temperatures and the frequency with which these occur has increased since the
mid-1970s. The rate of very hot daytime temperatures has also been growing since
the 1990s (Bureau of Meteorology 2017) (Fig. 8.1).
1.25
Australian annual mean temperature anomaly (°C)
1.00
0.75
0.50
0.25
-0.25
-0.50
-0.75
-1.00
-1.25
1910 1920 1930 1940 1950 1960 1970 1980 1990 2000 2010
10-year mean
© Australian Bureau of Meteorology
Departures from 1961-1990 average
0.00
Fig. 8.1 Annual mean temperature anomalies for Australia (red) with 10-year mean (light grey).
Departures are from the 1960 to 1990 average. (Source: Bureau of Meteorology, data from the
Australian Climate Observations Reference Network – Surface Air Temperature (ACORN-SAT))
120
G. Davis