

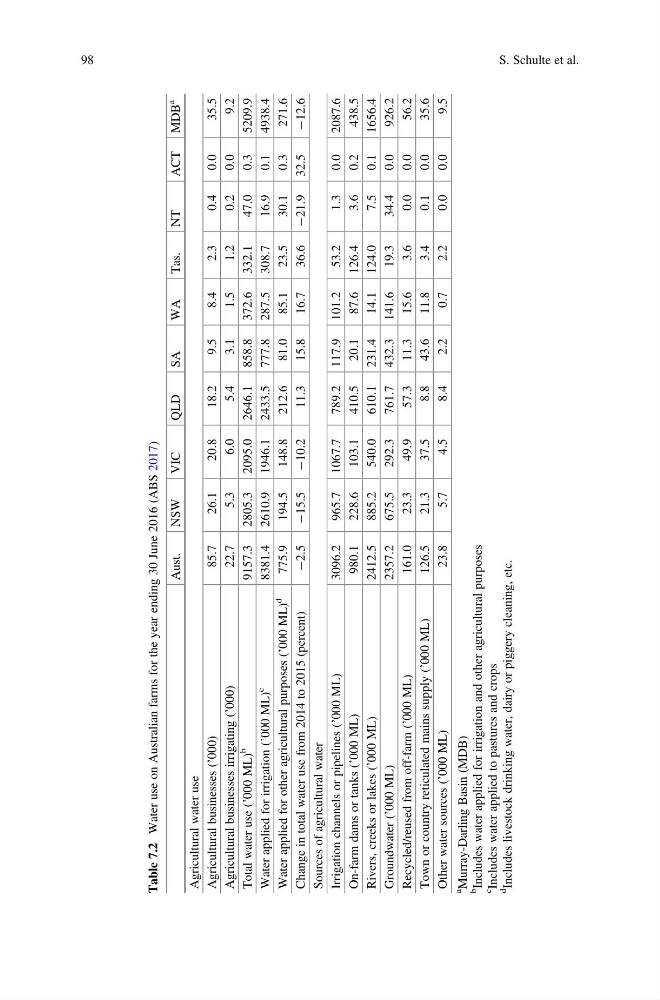
Table 7.2
Water use on Australian farms for the year ending 30 June 2016 (ABS 2017)
Aust.
NSW
VIC
QLD
SA
WA
Tas.
NT
ACT MDB
a
Agricultural water use
Agricultural businesses (’000)
85.7
26.1
20.8
18.2
9.5
8.4
2.3
0.4
0.0
35.5
Agricultural businesses irrigating (’000)
22.7
5.3
6.0
5.4
3.1
1.5
1.2
0.2
0.0
9.2
Total water use (’000 ML)
b
9157.3 2805.3 2095.0 2646.1 858.8 372.6 332.1
47.0
0.3
5209.9
Water applied for irrigation (’000 ML)
c
8381.4 2610.9 1946.1 2433.5 777.8 287.5 308.7
16.9
0.1
4938.4
Water applied for other agricultural purposes (’000 ML)
d
775.9
194.5
148.8
212.6
81.0
85.1
23.5
30.1
0.3
271.6
Change in total water use from 2014 to 2015 (percent)
À2.5
À15.5
À10.2
11.3
15.8
16.7
36.6
À21.9 32.5
À12.6
Sources of agricultural water
Irrigation channels or pipelines (’000 ML)
3096.2
965.7 1067.7
789.2 117.9 101.2
53.2
1.3
0.0
2087.6
On-farm dams or tanks (’000 ML)
980.1
228.6
103.1
410.5
20.1
87.6 126.4
3.6
0.2
438.5
Rivers, creeks or lakes (’000 ML)
2412.5
885.2
540.0
610.1 231.4
14.1 124.0
7.5
0.1
1656.4
Groundwater (’000 ML)
2357.2
675.5
292.3
761.7 432.3 141.6
19.3
34.4
0.0
926.2
Recycled/reused from off-farm (’000 ML)
161.0
23.3
49.9
57.3
11.3
15.6
3.6
0.0
0.0
56.2
Town or country reticulated mains supply (’000 ML)
126.5
21.3
37.5
8.8
43.6
11.8
3.4
0.1
0.0
35.6
Other water sources (’000 ML)
23.8
5.7
4.5
8.4
2.2
0.7
2.2
0.0
0.0
9.5
a
Murray-Darling Basin (MDB)
b
Includes water applied for irrigation and other agricultural purposes
c
Includes water applied to pastures and crops
d
Includes livestock drinking water, dairy or piggery cleaning, etc.
98
S. Schulte et al.
Water use on Australian farms for the year ending 30 June 2016 (ABS 2017)
Aust.
NSW
VIC
QLD
SA
WA
Tas.
NT
ACT MDB
a
Agricultural water use
Agricultural businesses (’000)
85.7
26.1
20.8
18.2
9.5
8.4
2.3
0.4
0.0
35.5
Agricultural businesses irrigating (’000)
22.7
5.3
6.0
5.4
3.1
1.5
1.2
0.2
0.0
9.2
Total water use (’000 ML)
b
9157.3 2805.3 2095.0 2646.1 858.8 372.6 332.1
47.0
0.3
5209.9
Water applied for irrigation (’000 ML)
c
8381.4 2610.9 1946.1 2433.5 777.8 287.5 308.7
16.9
0.1
4938.4
Water applied for other agricultural purposes (’000 ML)
d
775.9
194.5
148.8
212.6
81.0
85.1
23.5
30.1
0.3
271.6
Change in total water use from 2014 to 2015 (percent)
À2.5
À15.5
À10.2
11.3
15.8
16.7
36.6
À21.9 32.5
À12.6
Sources of agricultural water
Irrigation channels or pipelines (’000 ML)
3096.2
965.7 1067.7
789.2 117.9 101.2
53.2
1.3
0.0
2087.6
On-farm dams or tanks (’000 ML)
980.1
228.6
103.1
410.5
20.1
87.6 126.4
3.6
0.2
438.5
Rivers, creeks or lakes (’000 ML)
2412.5
885.2
540.0
610.1 231.4
14.1 124.0
7.5
0.1
1656.4
Groundwater (’000 ML)
2357.2
675.5
292.3
761.7 432.3 141.6
19.3
34.4
0.0
926.2
Recycled/reused from off-farm (’000 ML)
161.0
23.3
49.9
57.3
11.3
15.6
3.6
0.0
0.0
56.2
Town or country reticulated mains supply (’000 ML)
126.5
21.3
37.5
8.8
43.6
11.8
3.4
0.1
0.0
35.6
Other water sources (’000 ML)
23.8
5.7
4.5
8.4
2.2
0.7
2.2
0.0
0.0
9.5
a
Murray-Darling Basin (MDB)
b
Includes water applied for irrigation and other agricultural purposes
c
Includes water applied to pastures and crops
d
Includes livestock drinking water, dairy or piggery cleaning, etc.
98
S. Schulte et al.