

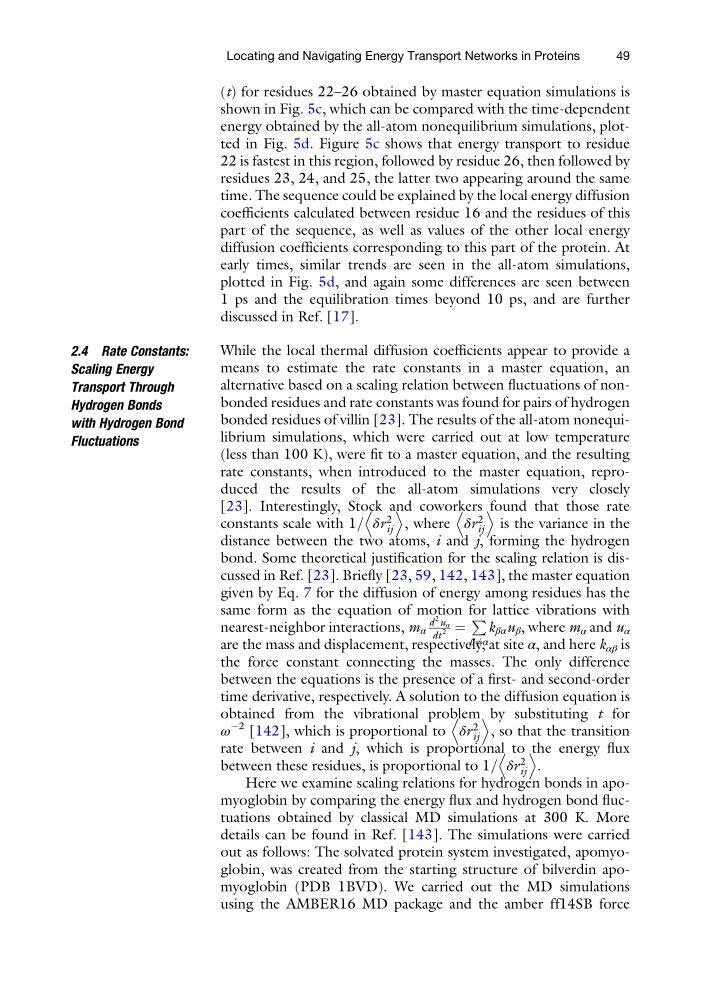
(t) for residues 22–26 obtained by master equation simulations is
shown in Fig. 5c, which can be compared with the time-dependent
energy obtained by the all-atom nonequilibrium simulations, plotted in Fig. 5d. Figure 5c shows that energy transport to residue
22 is fastest in this region, followed by residue 26, then followed by
residues 23, 24, and 25, the latter two appearing around the same
time. The sequence could be explained by the local energy diffusion
coefficients calculated between residue 16 and the residues of this
part of the sequence, as well as values of the other local energy
diffusion coefficients corresponding to this part of the protein. At
early times, similar trends are seen in the all-atom simulations,
plotted in Fig. 5d, and again some differences are seen between
1 ps and the equilibration times beyond 10 ps, and are further
discussed in Ref. [17].
2.4 Rate Constants:
Scaling Energy
Transport Through
Hydrogen Bonds
with Hydrogen Bond
Fluctuations
While the local thermal diffusion coefficients appear to provide a
means to estimate the rate constants in a master equation, an
alternative based on a scaling relation between fluctuations of nonbonded residues and rate constants was found for pairs of hydrogen
bonded residues of villin [23]. The results of the all-atom nonequilibrium simulations, which were carried out at low temperature
(less than 100 K), were fit to a master equation, and the resulting
rate constants, when introduced to the master equation, reproduced the results of the all-atom simulations very closely
[23]. Interestingly, Stock and coworkers found that those rate
constants scale with 1= δr
2
ij
D
E
, where δr
2
ij
D
E
is the variance in the
distance between the two atoms, i and j, forming the hydrogen
bond. Some theoretical justification for the scaling relation is discussed in Ref. [23]. Briefly [23, 59, 142, 143], the master equation
given by Eq. 7 for the diffusion of energy among residues has the
same form as the equation of motion for lattice vibrations with
nearest-neighbor interactions, m α
d
2 u α
dt
2 ¼
P
β6 ¼α
k βα u β , where m α and u α
are the mass and displacement, respectively, at site α, and here k αβ is
the force constant connecting the masses. The only difference
between the equations is the presence of a first- and second-order
time derivative, respectively. A solution to the diffusion equation is
obtained from the vibrational problem by substituting t for
ω
À2 [142], which is proportional to δr
2
ij
D
E
, so that the transition
rate between i and j, which is proportional to the energy flux
between these residues, is proportional to 1= δr
2
ij
D
E
.
Here we examine scaling relations for hydrogen bonds in apomyoglobin by comparing the energy flux and hydrogen bond fluctuations obtained by classical MD simulations at 300 K. More
details can be found in Ref. [143]. The simulations were carried
out as follows: The solvated protein system investigated, apomyoglobin, was created from the starting structure of bilverdin apomyoglobin (PDB 1BVD). We carried out the MD simulations
using the AMBER16 MD package and the amber ff14SB force
Locating and Navigating Energy Transport Networks in Proteins
49
shown in Fig. 5c, which can be compared with the time-dependent
energy obtained by the all-atom nonequilibrium simulations, plotted in Fig. 5d. Figure 5c shows that energy transport to residue
22 is fastest in this region, followed by residue 26, then followed by
residues 23, 24, and 25, the latter two appearing around the same
time. The sequence could be explained by the local energy diffusion
coefficients calculated between residue 16 and the residues of this
part of the sequence, as well as values of the other local energy
diffusion coefficients corresponding to this part of the protein. At
early times, similar trends are seen in the all-atom simulations,
plotted in Fig. 5d, and again some differences are seen between
1 ps and the equilibration times beyond 10 ps, and are further
discussed in Ref. [17].
2.4 Rate Constants:
Scaling Energy
Transport Through
Hydrogen Bonds
with Hydrogen Bond
Fluctuations
While the local thermal diffusion coefficients appear to provide a
means to estimate the rate constants in a master equation, an
alternative based on a scaling relation between fluctuations of nonbonded residues and rate constants was found for pairs of hydrogen
bonded residues of villin [23]. The results of the all-atom nonequilibrium simulations, which were carried out at low temperature
(less than 100 K), were fit to a master equation, and the resulting
rate constants, when introduced to the master equation, reproduced the results of the all-atom simulations very closely
[23]. Interestingly, Stock and coworkers found that those rate
constants scale with 1= δr
2
ij
D
E
, where δr
2
ij
D
E
is the variance in the
distance between the two atoms, i and j, forming the hydrogen
bond. Some theoretical justification for the scaling relation is discussed in Ref. [23]. Briefly [23, 59, 142, 143], the master equation
given by Eq. 7 for the diffusion of energy among residues has the
same form as the equation of motion for lattice vibrations with
nearest-neighbor interactions, m α
d
2 u α
dt
2 ¼
P
β6 ¼α
k βα u β , where m α and u α
are the mass and displacement, respectively, at site α, and here k αβ is
the force constant connecting the masses. The only difference
between the equations is the presence of a first- and second-order
time derivative, respectively. A solution to the diffusion equation is
obtained from the vibrational problem by substituting t for
ω
À2 [142], which is proportional to δr
2
ij
D
E
, so that the transition
rate between i and j, which is proportional to the energy flux
between these residues, is proportional to 1= δr
2
ij
D
E
.
Here we examine scaling relations for hydrogen bonds in apomyoglobin by comparing the energy flux and hydrogen bond fluctuations obtained by classical MD simulations at 300 K. More
details can be found in Ref. [143]. The simulations were carried
out as follows: The solvated protein system investigated, apomyoglobin, was created from the starting structure of bilverdin apomyoglobin (PDB 1BVD). We carried out the MD simulations
using the AMBER16 MD package and the amber ff14SB force
Locating and Navigating Energy Transport Networks in Proteins
49