

information on the target protein is required, with initial structure
usually extracted from the reference database for protein structures,
i.e., the Protein Data Bank [36]. The protein dynamics is preferentially simulated in realistic environmental conditions, i.e., in presence of the explicit solvent (generally water) and eventually, if the
protein is particularly small, accounting for appropriate salt concentration. The whole system is generally comprised within a cubic
box, which is then periodically replicated using periodic boundary
conditions.
2.2 Molecular
Dynamics Simulations
Several freely distributed coded are available for performing classical MD simulations, including for instance AMBER [37], GROMACS [38], and NAMD [39], which also an extended set of useful
tutorials for beginners [40–42]. In our applications of the CNA
method, we have employed the NAMD software, choosing the
AMBER (all-atom) force fields [37, 43] to describe the interactions
between atoms. Anyway, the choice of a different all-atom force
field does not exclude the possibility of performing the CNA analysis, as explained in the following section. A time window for the
CNA analysis has to be selected, in order to perform MD simulations of opportune lengths (see Note 1). Standard MD simulations
generally provide trajectories for not more than few micorseconds
and thus enough statistics could be collected for time windows of
few hundreds of nanoseconds (see Note 2), a timescale in which
several protein motions (such as unhindered surface side chain loop
motions, collective motions, partial folding/unfolding, helix-coil
transitions, etc.), eventually related to allostery, already occur.
2.3 Protein Motion
Correlations
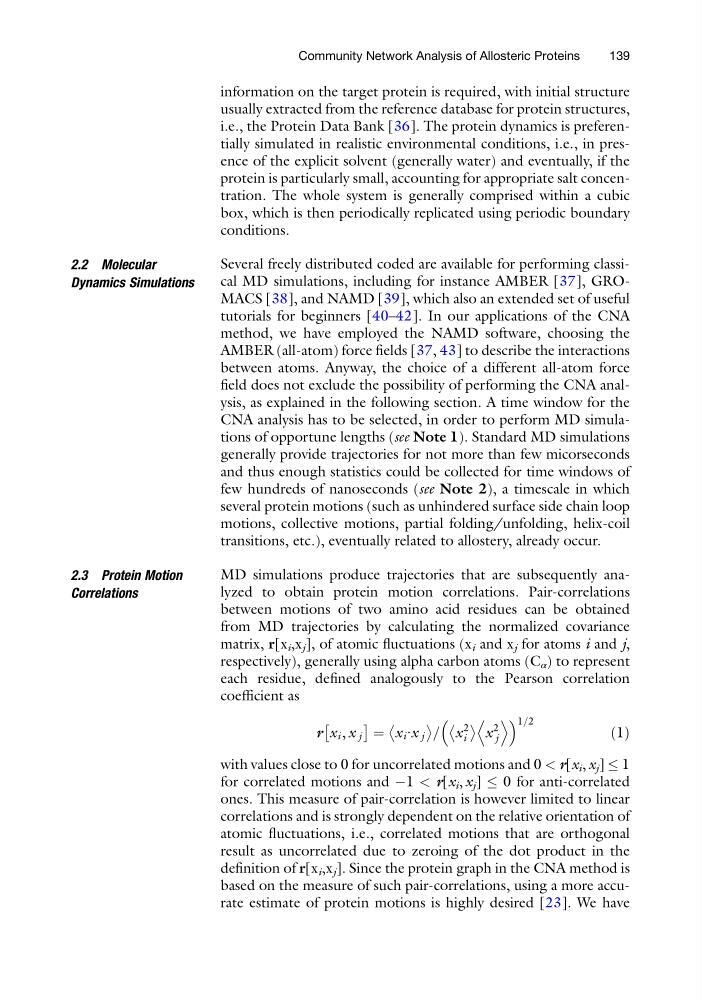
MD simulations produce trajectories that are subsequently analyzed to obtain protein motion correlations. Pair-correlations
between motions of two amino acid residues can be obtained
from MD trajectories by calculating the normalized covariance
matrix, r[x i ,x j ], of atomic fluctuations (x i and x j for atoms i and j,
respectively), generally using alpha carbon atoms (C α ) to represent
each residue, defined analogously to the Pearson correlation
coefficient as
r x i , x j
Â
à ¼ x i ∙x j
= x
2
i
x
2
j
D E
1=2
ð1Þ
with values close to 0 for uncorrelated motions and 0 < r[x i , x j ] 1
for correlated motions and À1 < r[x i , x j ] 0 for anti-correlated
ones. This measure of pair-correlation is however limited to linear
correlations and is strongly dependent on the relative orientation of
atomic fluctuations, i.e., correlated motions that are orthogonal
result as uncorrelated due to zeroing of the dot product in the
definition of r[x i ,x j ]. Since the protein graph in the CNA method is
based on the measure of such pair-correlations, using a more accurate estimate of protein motions is highly desired [23]. We have
Community Network Analysis of Allosteric Proteins
139
usually extracted from the reference database for protein structures,
i.e., the Protein Data Bank [36]. The protein dynamics is preferentially simulated in realistic environmental conditions, i.e., in presence of the explicit solvent (generally water) and eventually, if the
protein is particularly small, accounting for appropriate salt concentration. The whole system is generally comprised within a cubic
box, which is then periodically replicated using periodic boundary
conditions.
2.2 Molecular
Dynamics Simulations
Several freely distributed coded are available for performing classical MD simulations, including for instance AMBER [37], GROMACS [38], and NAMD [39], which also an extended set of useful
tutorials for beginners [40–42]. In our applications of the CNA
method, we have employed the NAMD software, choosing the
AMBER (all-atom) force fields [37, 43] to describe the interactions
between atoms. Anyway, the choice of a different all-atom force
field does not exclude the possibility of performing the CNA analysis, as explained in the following section. A time window for the
CNA analysis has to be selected, in order to perform MD simulations of opportune lengths (see Note 1). Standard MD simulations
generally provide trajectories for not more than few micorseconds
and thus enough statistics could be collected for time windows of
few hundreds of nanoseconds (see Note 2), a timescale in which
several protein motions (such as unhindered surface side chain loop
motions, collective motions, partial folding/unfolding, helix-coil
transitions, etc.), eventually related to allostery, already occur.
2.3 Protein Motion
Correlations
MD simulations produce trajectories that are subsequently analyzed to obtain protein motion correlations. Pair-correlations
between motions of two amino acid residues can be obtained
from MD trajectories by calculating the normalized covariance
matrix, r[x i ,x j ], of atomic fluctuations (x i and x j for atoms i and j,
respectively), generally using alpha carbon atoms (C α ) to represent
each residue, defined analogously to the Pearson correlation
coefficient as
r x i , x j
Â
à ¼ x i ∙x j
= x
2
i
x
2
j
D E
1=2
ð1Þ
with values close to 0 for uncorrelated motions and 0 < r[x i , x j ] 1
for correlated motions and À1 < r[x i , x j ] 0 for anti-correlated
ones. This measure of pair-correlation is however limited to linear
correlations and is strongly dependent on the relative orientation of
atomic fluctuations, i.e., correlated motions that are orthogonal
result as uncorrelated due to zeroing of the dot product in the
definition of r[x i ,x j ]. Since the protein graph in the CNA method is
based on the measure of such pair-correlations, using a more accurate estimate of protein motions is highly desired [23]. We have
Community Network Analysis of Allosteric Proteins
139