

48
economics spectrum (Wright et al. 2004), and the development of global-scale
foliar trait databases (Kattge et al. 2011). Within the signals observed by passive
optical, thermal, and active sensing systems, such as light detection and ranging
(lidar) platforms, is a whole host of underlying leaf chemical, physiological, and
plant structure information that drives the spatial and temporal variation in RS
observations (Ollinger 2011; Figs. 3.1, 3.2, and 3.3). As a result, RS provides the
only truly practical approach to observing spatial and temporal variation in plant
traits, canopy structure, ecosystem functioning, and biodiversity in absence of being
able to map all species or communities everywhere (Schimel et al. 2015; Jetz et al.
2016). RS observations can provide the synoptic view of terrestrial ecosystems and
capture changes on the landscape from disturbances and necessary temporal coverage via multiple repeat passes or targeted collection at specific phenological
stages, yielding information needed to fill critical gaps in trait observations across
global biomes (Cavender-Bares et al. 2017; Schimel et al., Chap. 19).
3.1.2 Historical Advances in Remote Sensing of Vegetation
Over the last four-plus decades, passive optical RS has been used as a key tool for
characterizing and monitoring the composition, structure, and functioning of terrestrial ecosystems across space and time. For example, spectral vegetation indices
(SVIs), such as the normalized difference vegetation index (NDVI), have been used
to capture broad-scale plant seasonality or phenology and changes in composition,
monitor plant pigmentation and stress, and track changes in productivity through
time and in response to environmental change (e.g., Goward and Huemmrich 1992;
Kasischke et al. 1993; Myneni and Williams 1994; Gamon et al. 1995; Ahl et al.
2006; Mand et al. 2010). Platforms, such as the Advanced Very High Resolution
Radiometer (AVHRR), originally designed for atmospheric research, have been
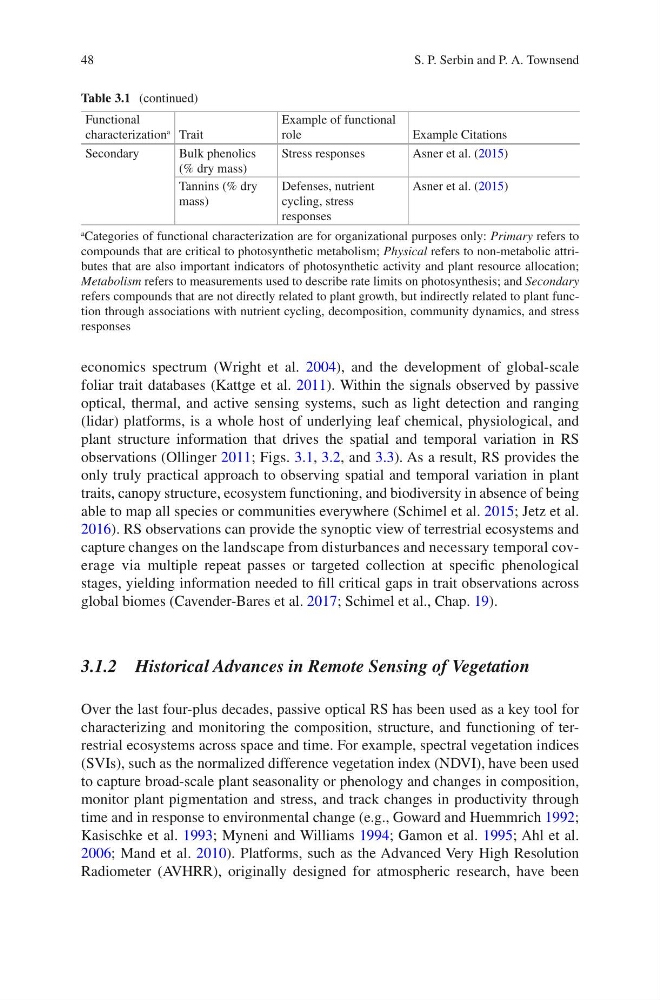
Table 3.1 (continued)
Functional
characterization
a Trait
Example of functional
role
Example Citations
Secondary
Bulk phenolics
(% dry mass)
Stress responses
Asner et al. (2015)
Tannins (% dry
mass)
Defenses, nutrient
cycling, stress
responses
Asner et al. (2015)
a
Categories of functional characterization are for organizational purposes only: Primary refers to
compounds that are critical to photosynthetic metabolism; Physical refers to non-metabolic attributes that are also important indicators of photosynthetic activity and plant resource allocation;
Metabolism refers to measurements used to describe rate limits on photosynthesis; and Secondary
refers compounds that are not directly related to plant growth, but indirectly related to plant function through associations with nutrient cycling, decomposition, community dynamics, and stress
responses
S. P. Serbin and P. A. Townsend
economics spectrum (Wright et al. 2004), and the development of global-scale
foliar trait databases (Kattge et al. 2011). Within the signals observed by passive
optical, thermal, and active sensing systems, such as light detection and ranging
(lidar) platforms, is a whole host of underlying leaf chemical, physiological, and
plant structure information that drives the spatial and temporal variation in RS
observations (Ollinger 2011; Figs. 3.1, 3.2, and 3.3). As a result, RS provides the
only truly practical approach to observing spatial and temporal variation in plant
traits, canopy structure, ecosystem functioning, and biodiversity in absence of being
able to map all species or communities everywhere (Schimel et al. 2015; Jetz et al.
2016). RS observations can provide the synoptic view of terrestrial ecosystems and
capture changes on the landscape from disturbances and necessary temporal coverage via multiple repeat passes or targeted collection at specific phenological
stages, yielding information needed to fill critical gaps in trait observations across
global biomes (Cavender-Bares et al. 2017; Schimel et al., Chap. 19).
3.1.2 Historical Advances in Remote Sensing of Vegetation
Over the last four-plus decades, passive optical RS has been used as a key tool for
characterizing and monitoring the composition, structure, and functioning of terrestrial ecosystems across space and time. For example, spectral vegetation indices
(SVIs), such as the normalized difference vegetation index (NDVI), have been used
to capture broad-scale plant seasonality or phenology and changes in composition,
monitor plant pigmentation and stress, and track changes in productivity through
time and in response to environmental change (e.g., Goward and Huemmrich 1992;
Kasischke et al. 1993; Myneni and Williams 1994; Gamon et al. 1995; Ahl et al.
2006; Mand et al. 2010). Platforms, such as the Advanced Very High Resolution
Radiometer (AVHRR), originally designed for atmospheric research, have been
Table 3.1 (continued)
Functional
characterization
a Trait
Example of functional
role
Example Citations
Secondary
Bulk phenolics
(% dry mass)
Stress responses
Asner et al. (2015)
Tannins (% dry
mass)
Defenses, nutrient
cycling, stress
responses
Asner et al. (2015)
a
Categories of functional characterization are for organizational purposes only: Primary refers to
compounds that are critical to photosynthetic metabolism; Physical refers to non-metabolic attributes that are also important indicators of photosynthetic activity and plant resource allocation;
Metabolism refers to measurements used to describe rate limits on photosynthesis; and Secondary
refers compounds that are not directly related to plant growth, but indirectly related to plant function through associations with nutrient cycling, decomposition, community dynamics, and stress
responses
S. P. Serbin and P. A. Townsend