

579
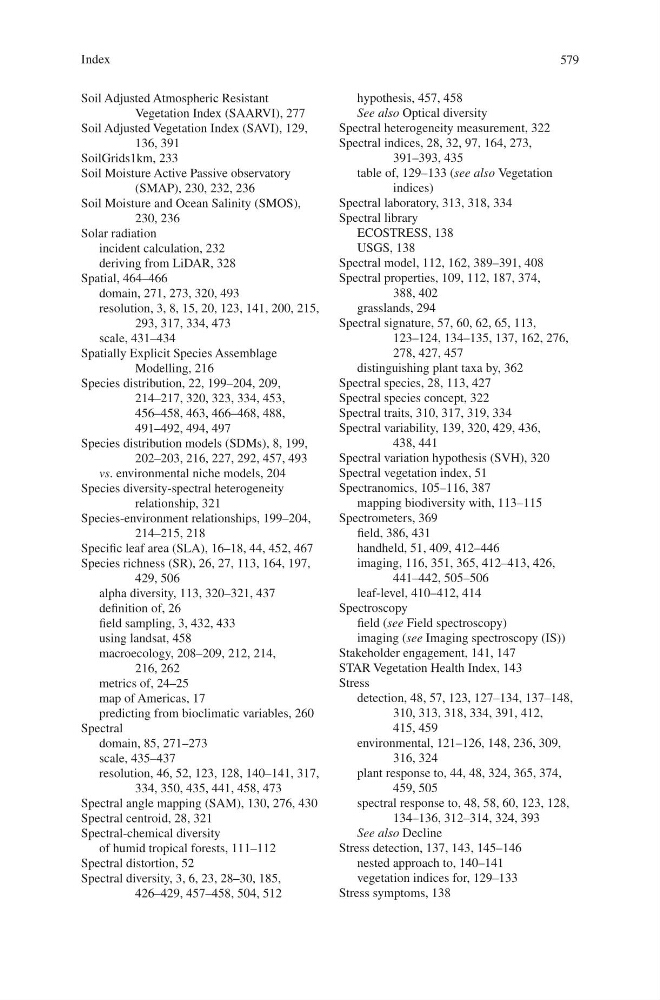
Soil Adjusted Atmospheric Resistant
Vegetation Index (SAARVI), 277
Soil Adjusted Vegetation Index (SAVI), 129,
136, 391
SoilGrids1km, 233
Soil Moisture Active Passive observatory
(SMAP), 230, 232, 236
Soil Moisture and Ocean Salinity (SMOS),
230, 236
Solar radiation
incident calculation, 232
deriving from LiDAR, 328
Spatial, 464–466
domain, 271, 273, 320, 493
resolution, 3, 8, 15, 20, 123, 141, 200, 215,
293, 317, 334, 473
scale, 431–434
Spatially Explicit Species Assemblage
Modelling, 216
Species distribution, 22, 199–204, 209,
214–217, 320, 323, 334, 453,
456–458, 463, 466–468, 488,
491–492, 494, 497
Species distribution models (SDMs), 8, 199,
202–203, 216, 227, 292, 457, 493
vs. environmental niche models, 204
Species diversity-spectral heterogeneity
relationship, 321
Species-environment relationships, 199–204,
214–215, 218
Specific leaf area (SLA), 16–18, 44, 452, 467
Species richness (SR), 26, 27, 113, 164, 197,
429, 506
alpha diversity, 113, 320–321, 437
definition of, 26
field sampling, 3, 432, 433
using landsat, 458
macroecology, 208–209, 212, 214,
216, 262
metrics of, 24–25
map of Americas, 17
predicting from bioclimatic variables, 260
Spectral
domain, 85, 271–273
scale, 435–437
resolution, 46, 52, 123, 128, 140–141, 317,
334, 350, 435, 441, 458, 473
Spectral angle mapping (SAM), 130, 276, 430
Spectral centroid, 28, 321
Spectral-chemical diversity
of humid tropical forests, 111–112
Spectral distortion, 52
Spectral diversity, 3, 6, 23, 28–30, 185,
426–429, 457–458, 504, 512
hypothesis, 457, 458
See also Optical diversity
Spectral heterogeneity measurement, 322
Spectral indices, 28, 32, 97, 164, 273,
391–393, 435
table of, 129–133 (see also Vegetation
indices)
Spectral laboratory, 313, 318, 334
Spectral library
ECOSTRESS, 138
USGS, 138
Spectral model, 112, 162, 389–391, 408
Spectral properties, 109, 112, 187, 374,
388, 402
grasslands, 294
Spectral signature, 57, 60, 62, 65, 113,
123–124, 134–135, 137, 162, 276,
278, 427, 457
distinguishing plant taxa by, 362
Spectral species, 28, 113, 427
Spectral species concept, 322
Spectral traits, 310, 317, 319, 334
Spectral variability, 139, 320, 429, 436,
438, 441
Spectral variation hypothesis (SVH), 320
Spectral vegetation index, 51
Spectranomics, 105–116, 387
mapping biodiversity with, 113–115
Spectrometers, 369
field, 386, 431
handheld, 51, 409, 412–446
imaging, 116, 351, 365, 412–413, 426,
441–442, 505–506
leaf-level, 410–412, 414
Spectroscopy
field (see Field spectroscopy)
imaging (see Imaging spectroscopy (IS))
Stakeholder engagement, 141, 147
STAR Vegetation Health Index, 143
Stress
detection, 48, 57, 123, 127–134, 137–148,
310, 313, 318, 334, 391, 412,
415, 459
environmental, 121–126, 148, 236, 309,
316, 324
plant response to, 44, 48, 324, 365, 374,
459, 505
spectral response to, 48, 58, 60, 123, 128,
134–136, 312–314, 324, 393
See also Decline
Stress detection, 137, 143, 145–146
nested approach to, 140–141
vegetation indices for, 129–133
Stress symptoms, 138
Index
Soil Adjusted Atmospheric Resistant
Vegetation Index (SAARVI), 277
Soil Adjusted Vegetation Index (SAVI), 129,
136, 391
SoilGrids1km, 233
Soil Moisture Active Passive observatory
(SMAP), 230, 232, 236
Soil Moisture and Ocean Salinity (SMOS),
230, 236
Solar radiation
incident calculation, 232
deriving from LiDAR, 328
Spatial, 464–466
domain, 271, 273, 320, 493
resolution, 3, 8, 15, 20, 123, 141, 200, 215,
293, 317, 334, 473
scale, 431–434
Spatially Explicit Species Assemblage
Modelling, 216
Species distribution, 22, 199–204, 209,
214–217, 320, 323, 334, 453,
456–458, 463, 466–468, 488,
491–492, 494, 497
Species distribution models (SDMs), 8, 199,
202–203, 216, 227, 292, 457, 493
vs. environmental niche models, 204
Species diversity-spectral heterogeneity
relationship, 321
Species-environment relationships, 199–204,
214–215, 218
Specific leaf area (SLA), 16–18, 44, 452, 467
Species richness (SR), 26, 27, 113, 164, 197,
429, 506
alpha diversity, 113, 320–321, 437
definition of, 26
field sampling, 3, 432, 433
using landsat, 458
macroecology, 208–209, 212, 214,
216, 262
metrics of, 24–25
map of Americas, 17
predicting from bioclimatic variables, 260
Spectral
domain, 85, 271–273
scale, 435–437
resolution, 46, 52, 123, 128, 140–141, 317,
334, 350, 435, 441, 458, 473
Spectral angle mapping (SAM), 130, 276, 430
Spectral centroid, 28, 321
Spectral-chemical diversity
of humid tropical forests, 111–112
Spectral distortion, 52
Spectral diversity, 3, 6, 23, 28–30, 185,
426–429, 457–458, 504, 512
hypothesis, 457, 458
See also Optical diversity
Spectral heterogeneity measurement, 322
Spectral indices, 28, 32, 97, 164, 273,
391–393, 435
table of, 129–133 (see also Vegetation
indices)
Spectral laboratory, 313, 318, 334
Spectral library
ECOSTRESS, 138
USGS, 138
Spectral model, 112, 162, 389–391, 408
Spectral properties, 109, 112, 187, 374,
388, 402
grasslands, 294
Spectral signature, 57, 60, 62, 65, 113,
123–124, 134–135, 137, 162, 276,
278, 427, 457
distinguishing plant taxa by, 362
Spectral species, 28, 113, 427
Spectral species concept, 322
Spectral traits, 310, 317, 319, 334
Spectral variability, 139, 320, 429, 436,
438, 441
Spectral variation hypothesis (SVH), 320
Spectral vegetation index, 51
Spectranomics, 105–116, 387
mapping biodiversity with, 113–115
Spectrometers, 369
field, 386, 431
handheld, 51, 409, 412–446
imaging, 116, 351, 365, 412–413, 426,
441–442, 505–506
leaf-level, 410–412, 414
Spectroscopy
field (see Field spectroscopy)
imaging (see Imaging spectroscopy (IS))
Stakeholder engagement, 141, 147
STAR Vegetation Health Index, 143
Stress
detection, 48, 57, 123, 127–134, 137–148,
310, 313, 318, 334, 391, 412,
415, 459
environmental, 121–126, 148, 236, 309,
316, 324
plant response to, 44, 48, 324, 365, 374,
459, 505
spectral response to, 48, 58, 60, 123, 128,
134–136, 312–314, 324, 393
See also Decline
Stress detection, 137, 143, 145–146
nested approach to, 140–141
vegetation indices for, 129–133
Stress symptoms, 138
Index