

35
contribute meaningfully to decision-making and resource management (ChaplinKramer et al. 2015; de Araujo Barbosa et al. 2015; Schrodt et al., Chap. 17).
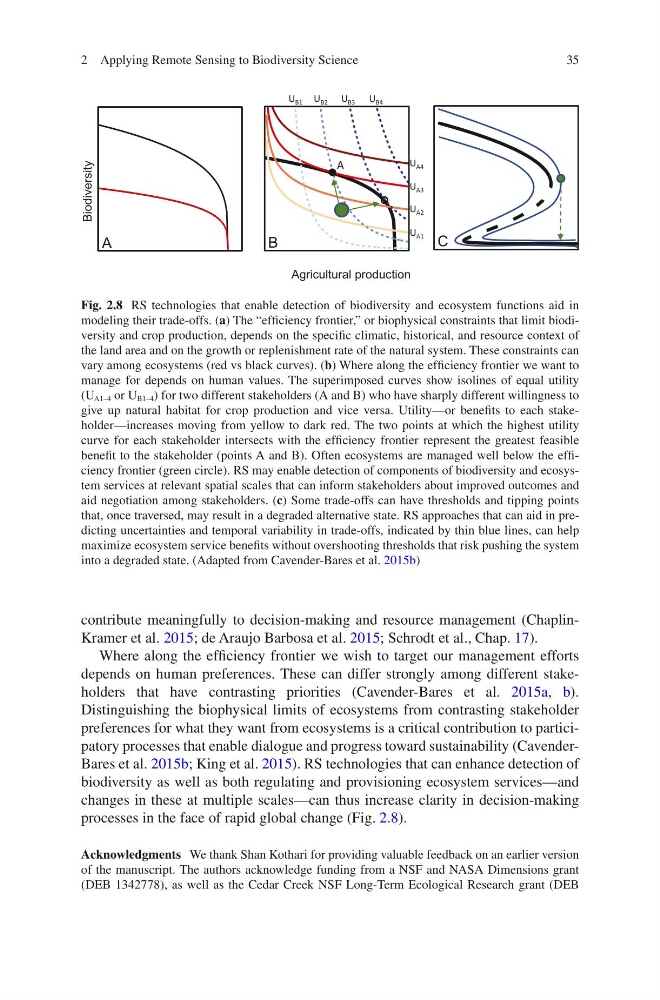
Where along the efficiency frontier we wish to target our management efforts
depends on human preferences. These can differ strongly among different stakeholders that have contrasting priorities (Cavender-Bares et al. 2015a, b).
Distinguishing the biophysical limits of ecosystems from contrasting stakeholder
preferences for what they want from ecosystems is a critical contribution to participatory processes that enable dialogue and progress toward sustainability (CavenderBares et al. 2015b; King et al. 2015). RS technologies that can enhance detection of
biodiversity as well as both regulating and provisioning ecosystem services—and
changes in these at multiple scales—can thus increase clarity in decision-making
processes in the face of rapid global change (Fig. 2.8).
Acknowledgments We thank Shan Kothari for providing valuable feedback on an earlier version
of the manuscript. The authors acknowledge funding from a NSF and NASA Dimensions grant
(DEB 1342778), as well as the Cedar Creek NSF Long-Term Ecological Research grant (DEB
U A4
U A3
U A2
U A1
U B4
U B3
U B2
U B1
A
Agricultural production
Biodiversity
A
B
C
Fig. 2.8 RS technologies that enable detection of biodiversity and ecosystem functions aid in
modeling their trade-offs. (a) The “efficiency frontier,” or biophysical constraints that limit biodiversity and crop production, depends on the specific climatic, historical, and resource context of
the land area and on the growth or replenishment rate of the natural system. These constraints can
vary among ecosystems (red vs black curves). (b) Where along the efficiency frontier we want to
manage for depends on human values. The superimposed curves show isolines of equal utility
(U A1–4 or U B1–4 ) for two different stakeholders (A and B) who have sharply different willingness to
give up natural habitat for crop production and vice versa. Utility—or benefits to each stakeholder—increases moving from yellow to dark red. The two points at which the highest utility
curve for each stakeholder intersects with the efficiency frontier represent the greatest feasible
benefit to the stakeholder (points A and B). Often ecosystems are managed well below the efficiency frontier (green circle). RS may enable detection of components of biodiversity and ecosystem services at relevant spatial scales that can inform stakeholders about improved outcomes and
aid negotiation among stakeholders. (c) Some trade-offs can have thresholds and tipping points
that, once traversed, may result in a degraded alternative state. RS approaches that can aid in predicting uncertainties and temporal variability in trade-offs, indicated by thin blue lines, can help
maximize ecosystem service benefits without overshooting thresholds that risk pushing the system
into a degraded state. (Adapted from Cavender-Bares et al. 2015b)
2 Applying Remote Sensing to Biodiversity Science
contribute meaningfully to decision-making and resource management (ChaplinKramer et al. 2015; de Araujo Barbosa et al. 2015; Schrodt et al., Chap. 17).
Where along the efficiency frontier we wish to target our management efforts
depends on human preferences. These can differ strongly among different stakeholders that have contrasting priorities (Cavender-Bares et al. 2015a, b).
Distinguishing the biophysical limits of ecosystems from contrasting stakeholder
preferences for what they want from ecosystems is a critical contribution to participatory processes that enable dialogue and progress toward sustainability (CavenderBares et al. 2015b; King et al. 2015). RS technologies that can enhance detection of
biodiversity as well as both regulating and provisioning ecosystem services—and
changes in these at multiple scales—can thus increase clarity in decision-making
processes in the face of rapid global change (Fig. 2.8).
Acknowledgments We thank Shan Kothari for providing valuable feedback on an earlier version
of the manuscript. The authors acknowledge funding from a NSF and NASA Dimensions grant
(DEB 1342778), as well as the Cedar Creek NSF Long-Term Ecological Research grant (DEB
U A4
U A3
U A2
U A1
U B4
U B3
U B2
U B1
A
Agricultural production
Biodiversity
A
B
C
Fig. 2.8 RS technologies that enable detection of biodiversity and ecosystem functions aid in
modeling their trade-offs. (a) The “efficiency frontier,” or biophysical constraints that limit biodiversity and crop production, depends on the specific climatic, historical, and resource context of
the land area and on the growth or replenishment rate of the natural system. These constraints can
vary among ecosystems (red vs black curves). (b) Where along the efficiency frontier we want to
manage for depends on human values. The superimposed curves show isolines of equal utility
(U A1–4 or U B1–4 ) for two different stakeholders (A and B) who have sharply different willingness to
give up natural habitat for crop production and vice versa. Utility—or benefits to each stakeholder—increases moving from yellow to dark red. The two points at which the highest utility
curve for each stakeholder intersects with the efficiency frontier represent the greatest feasible
benefit to the stakeholder (points A and B). Often ecosystems are managed well below the efficiency frontier (green circle). RS may enable detection of components of biodiversity and ecosystem services at relevant spatial scales that can inform stakeholders about improved outcomes and
aid negotiation among stakeholders. (c) Some trade-offs can have thresholds and tipping points
that, once traversed, may result in a degraded alternative state. RS approaches that can aid in predicting uncertainties and temporal variability in trade-offs, indicated by thin blue lines, can help
maximize ecosystem service benefits without overshooting thresholds that risk pushing the system
into a degraded state. (Adapted from Cavender-Bares et al. 2015b)
2 Applying Remote Sensing to Biodiversity Science