

437
A number of studies have demonstrated that some wavebands provide more
information than others, and this information can vary seasonally (Zutta 2003;
Chavana-Bryant et al. 2017; see also Fig. 16.4). Similarly, visible bands (revealing
pigment composition) and NIR bands (revealing structural information) respond
differently to spatial scale (Wang et al. 2018b) or sampling angle (Gamon 2015)
illustrating the functionally distinct responses of these different spectral regions
(Fig. 16.1) and providing further evidence of interactions between the spectral, spatial, and angular dimensions of scale.
16.2.5 Angular Scale
Illumination and view angle both interact with vegetation structure to influence the
shape and intensity (brightness) of reflectance spectra. While these effects have
been well-studied in RS and can be characterized by the BRDF for a particular
surface (Malenovský et al. 2007), angular information has generally not been
employed in detection of biodiversity. A few studies have noted that the BRDF
response can help distinguish vegetation types (Gamon et al. 2004), suggesting that
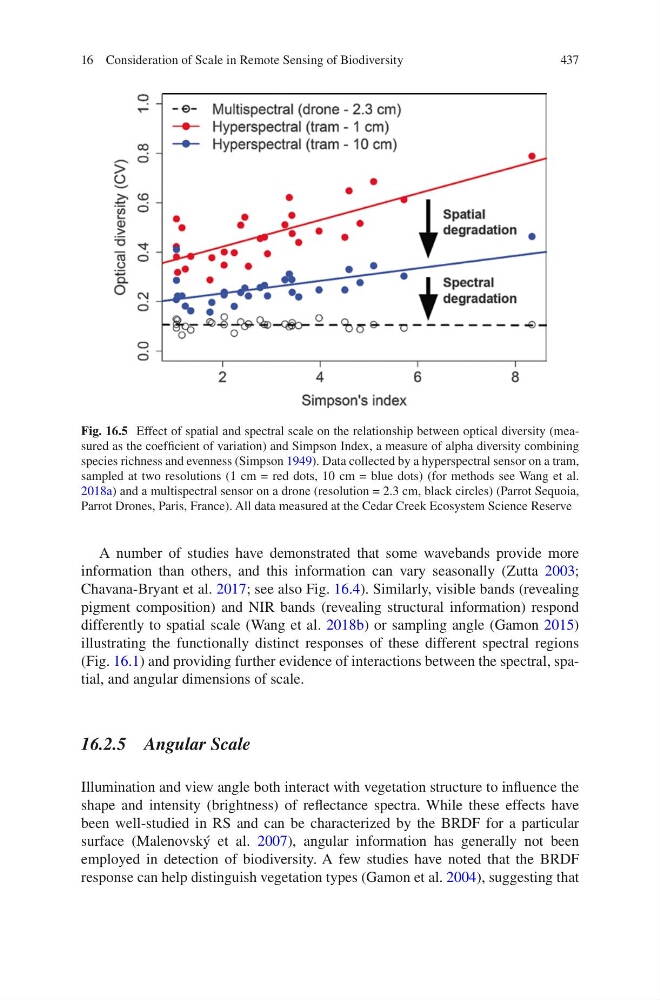
Fig. 16.5 Effect of spatial and spectral scale on the relationship between optical diversity (measured as the coefficient of variation) and Simpson Index, a measure of alpha diversity combining
species richness and evenness (Simpson 1949). Data collected by a hyperspectral sensor on a tram,
sampled at two resolutions (1 cm = red dots, 10 cm = blue dots) (for methods see Wang et al.
2018a) and a multispectral sensor on a drone (resolution = 2.3 cm, black circles) (Parrot Sequoia,
Parrot Drones, Paris, France). All data measured at the Cedar Creek Ecosystem Science Reserve
16 Consideration of Scale in Remote Sensing of Biodiversity
A number of studies have demonstrated that some wavebands provide more
information than others, and this information can vary seasonally (Zutta 2003;
Chavana-Bryant et al. 2017; see also Fig. 16.4). Similarly, visible bands (revealing
pigment composition) and NIR bands (revealing structural information) respond
differently to spatial scale (Wang et al. 2018b) or sampling angle (Gamon 2015)
illustrating the functionally distinct responses of these different spectral regions
(Fig. 16.1) and providing further evidence of interactions between the spectral, spatial, and angular dimensions of scale.
16.2.5 Angular Scale
Illumination and view angle both interact with vegetation structure to influence the
shape and intensity (brightness) of reflectance spectra. While these effects have
been well-studied in RS and can be characterized by the BRDF for a particular
surface (Malenovský et al. 2007), angular information has generally not been
employed in detection of biodiversity. A few studies have noted that the BRDF
response can help distinguish vegetation types (Gamon et al. 2004), suggesting that
Fig. 16.5 Effect of spatial and spectral scale on the relationship between optical diversity (measured as the coefficient of variation) and Simpson Index, a measure of alpha diversity combining
species richness and evenness (Simpson 1949). Data collected by a hyperspectral sensor on a tram,
sampled at two resolutions (1 cm = red dots, 10 cm = blue dots) (for methods see Wang et al.
2018a) and a multispectral sensor on a drone (resolution = 2.3 cm, black circles) (Parrot Sequoia,
Parrot Drones, Paris, France). All data measured at the Cedar Creek Ecosystem Science Reserve
16 Consideration of Scale in Remote Sensing of Biodiversity