

436
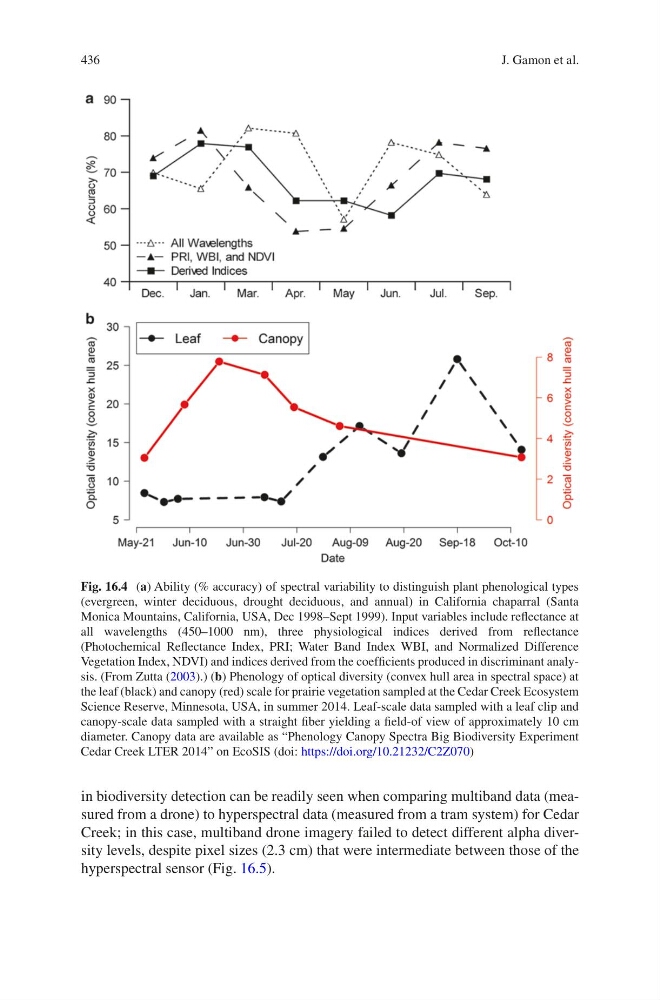
Fig. 16.4 (a) Ability (% accuracy) of spectral variability to distinguish plant phenological types
(evergreen, winter deciduous, drought deciduous, and annual) in California chaparral (Santa
Monica Mountains, California, USA, Dec 1998–Sept 1999). Input variables include reflectance at
all wavelengths (450–1000 nm), three physiological indices derived from reflectance
(Photochemical Reflectance Index, PRI; Water Band Index WBI, and Normalized Difference
Vegetation Index, NDVI) and indices derived from the coefficients produced in discriminant analysis. (From Zutta (2003).) (b) Phenology of optical diversity (convex hull area in spectral space) at
the leaf (black) and canopy (red) scale for prairie vegetation sampled at the Cedar Creek Ecosystem
Science Reserve, Minnesota, USA, in summer 2014. Leaf-scale data sampled with a leaf clip and
canopy-scale data sampled with a straight fiber yielding a field-of view of approximately 10 cm
diameter. Canopy data are available as “Phenology Canopy Spectra Big Biodiversity Experiment
Cedar Creek LTER 2014” on EcoSIS (doi: https://doi.org/10.21232/C2Z070)
in biodiversity detection can be readily seen when comparing multiband data (measured from a drone) to hyperspectral data (measured from a tram system) for Cedar
Creek; in this case, multiband drone imagery failed to detect different alpha diversity levels, despite pixel sizes (2.3 cm) that were intermediate between those of the
hyperspectral sensor (Fig. 16.5).
J. Gamon et al.
Fig. 16.4 (a) Ability (% accuracy) of spectral variability to distinguish plant phenological types
(evergreen, winter deciduous, drought deciduous, and annual) in California chaparral (Santa
Monica Mountains, California, USA, Dec 1998–Sept 1999). Input variables include reflectance at
all wavelengths (450–1000 nm), three physiological indices derived from reflectance
(Photochemical Reflectance Index, PRI; Water Band Index WBI, and Normalized Difference
Vegetation Index, NDVI) and indices derived from the coefficients produced in discriminant analysis. (From Zutta (2003).) (b) Phenology of optical diversity (convex hull area in spectral space) at
the leaf (black) and canopy (red) scale for prairie vegetation sampled at the Cedar Creek Ecosystem
Science Reserve, Minnesota, USA, in summer 2014. Leaf-scale data sampled with a leaf clip and
canopy-scale data sampled with a straight fiber yielding a field-of view of approximately 10 cm
diameter. Canopy data are available as “Phenology Canopy Spectra Big Biodiversity Experiment
Cedar Creek LTER 2014” on EcoSIS (doi: https://doi.org/10.21232/C2Z070)
in biodiversity detection can be readily seen when comparing multiband data (measured from a drone) to hyperspectral data (measured from a tram system) for Cedar
Creek; in this case, multiband drone imagery failed to detect different alpha diversity levels, despite pixel sizes (2.3 cm) that were intermediate between those of the
hyperspectral sensor (Fig. 16.5).
J. Gamon et al.