

429
usually not the case, in part because species’ spectra are dynamic and in part because
intraspecific spectral variation may approach or exceed that of interspecific variation, particularly when the full range of environmental conditions is expressed
(Roth et al. 2015). For these reasons, the number of distinguishable spectral types
does not always match the number of species in a given area.
An alternate definition refers to the amount of spectral variability in a given area
using statistical metrics of spectral information content, which can be measured
many ways (Table 16.2). This concept has an early expression in the spectral variability hypothesis, which stated that variation in spectral characteristics scales with
species richness (Palmer et al. 2000, 2002). In recent years, this concept has been
further developed in many studies that explore the links between expressions of
spectral variability and metrics of biodiversity, typically at the level of alpha or beta
diversity (Baldeck et al. 2014; Féret and Asner 2014; Wang et al. 2016; Wang et al.
2018a; Gholizadeh et al. 2019).
Many spectral variability methods derive from information theory, which provides a rich array of methods for assessing the abstract “information content” or
“entropy” in a given data set (Table 16.2). One simple method expresses spectral
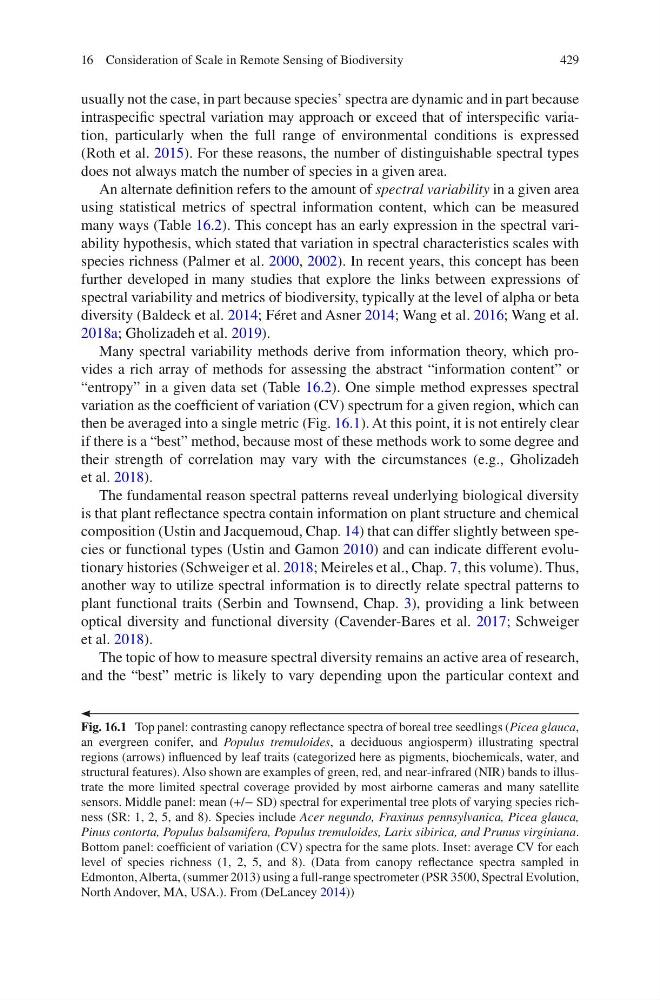
variation as the coefficient of variation (CV) spectrum for a given region, which can
then be averaged into a single metric (Fig. 16.1). At this point, it is not entirely clear
if there is a “best” method, because most of these methods work to some degree and
their strength of correlation may vary with the circumstances (e.g., Gholizadeh
et al. 2018).
The fundamental reason spectral patterns reveal underlying biological diversity
is that plant reflectance spectra contain information on plant structure and chemical
composition (Ustin and Jacquemoud, Chap. 14) that can differ slightly between species or functional types (Ustin and Gamon 2010) and can indicate different evolutionary histories (Schweiger et al. 2018; Meireles et al., Chap. 7, this volume). Thus,
another way to utilize spectral information is to directly relate spectral patterns to
plant functional traits (Serbin and Townsend, Chap. 3), providing a link between
optical diversity and functional diversity (Cavender-Bares et al. 2017; Schweiger
et al. 2018).
The topic of how to measure spectral diversity remains an active area of research,
and the “best” metric is likely to vary depending upon the particular context and
Fig. 16.1 Top panel: contrasting canopy reflectance spectra of boreal tree seedlings (Picea glauca,
an evergreen conifer, and Populus tremuloides, a deciduous angiosperm) illustrating spectral
regions (arrows) influenced by leaf traits (categorized here as pigments, biochemicals, water, and
structural features). Also shown are examples of green, red, and near-infrared (NIR) bands to illustrate the more limited spectral coverage provided by most airborne cameras and many satellite
sensors. Middle panel: mean (+/− SD) spectral for experimental tree plots of varying species richness (SR: 1, 2, 5, and 8). Species include Acer negundo, Fraxinus pennsylvanica, Picea glauca,
Pinus contorta, Populus balsamifera, Populus tremuloides, Larix sibirica, and Prunus virginiana.
Bottom panel: coefficient of variation (CV) spectra for the same plots. Inset: average CV for each
level of species richness (1, 2, 5, and 8). (Data from canopy reflectance spectra sampled in
Edmonton, Alberta, (summer 2013) using a full-range spectrometer (PSR 3500, Spectral Evolution,
North Andover, MA, USA.). From (DeLancey 2014))
16 Consideration of Scale in Remote Sensing of Biodiversity
usually not the case, in part because species’ spectra are dynamic and in part because
intraspecific spectral variation may approach or exceed that of interspecific variation, particularly when the full range of environmental conditions is expressed
(Roth et al. 2015). For these reasons, the number of distinguishable spectral types
does not always match the number of species in a given area.
An alternate definition refers to the amount of spectral variability in a given area
using statistical metrics of spectral information content, which can be measured
many ways (Table 16.2). This concept has an early expression in the spectral variability hypothesis, which stated that variation in spectral characteristics scales with
species richness (Palmer et al. 2000, 2002). In recent years, this concept has been
further developed in many studies that explore the links between expressions of
spectral variability and metrics of biodiversity, typically at the level of alpha or beta
diversity (Baldeck et al. 2014; Féret and Asner 2014; Wang et al. 2016; Wang et al.
2018a; Gholizadeh et al. 2019).
Many spectral variability methods derive from information theory, which provides a rich array of methods for assessing the abstract “information content” or
“entropy” in a given data set (Table 16.2). One simple method expresses spectral
variation as the coefficient of variation (CV) spectrum for a given region, which can
then be averaged into a single metric (Fig. 16.1). At this point, it is not entirely clear
if there is a “best” method, because most of these methods work to some degree and
their strength of correlation may vary with the circumstances (e.g., Gholizadeh
et al. 2018).
The fundamental reason spectral patterns reveal underlying biological diversity
is that plant reflectance spectra contain information on plant structure and chemical
composition (Ustin and Jacquemoud, Chap. 14) that can differ slightly between species or functional types (Ustin and Gamon 2010) and can indicate different evolutionary histories (Schweiger et al. 2018; Meireles et al., Chap. 7, this volume). Thus,
another way to utilize spectral information is to directly relate spectral patterns to
plant functional traits (Serbin and Townsend, Chap. 3), providing a link between
optical diversity and functional diversity (Cavender-Bares et al. 2017; Schweiger
et al. 2018).
The topic of how to measure spectral diversity remains an active area of research,
and the “best” metric is likely to vary depending upon the particular context and
Fig. 16.1 Top panel: contrasting canopy reflectance spectra of boreal tree seedlings (Picea glauca,
an evergreen conifer, and Populus tremuloides, a deciduous angiosperm) illustrating spectral
regions (arrows) influenced by leaf traits (categorized here as pigments, biochemicals, water, and
structural features). Also shown are examples of green, red, and near-infrared (NIR) bands to illustrate the more limited spectral coverage provided by most airborne cameras and many satellite
sensors. Middle panel: mean (+/− SD) spectral for experimental tree plots of varying species richness (SR: 1, 2, 5, and 8). Species include Acer negundo, Fraxinus pennsylvanica, Picea glauca,
Pinus contorta, Populus balsamifera, Populus tremuloides, Larix sibirica, and Prunus virginiana.
Bottom panel: coefficient of variation (CV) spectra for the same plots. Inset: average CV for each
level of species richness (1, 2, 5, and 8). (Data from canopy reflectance spectra sampled in
Edmonton, Alberta, (summer 2013) using a full-range spectrometer (PSR 3500, Spectral Evolution,
North Andover, MA, USA.). From (DeLancey 2014))
16 Consideration of Scale in Remote Sensing of Biodiversity