

373
these wavelengths to easily measure them in the optical region. Airborne imaging
spectrometer data use one or both of the two wavelength regions (940–1020 nm and
1100–1300 nm) for calibrating an RT model for absorptions and scattering in the
atmosphere to fit to the measured spectrum. The water vapor, liquid water, and ice
concentrations are then estimated from the best fit of the RT model.
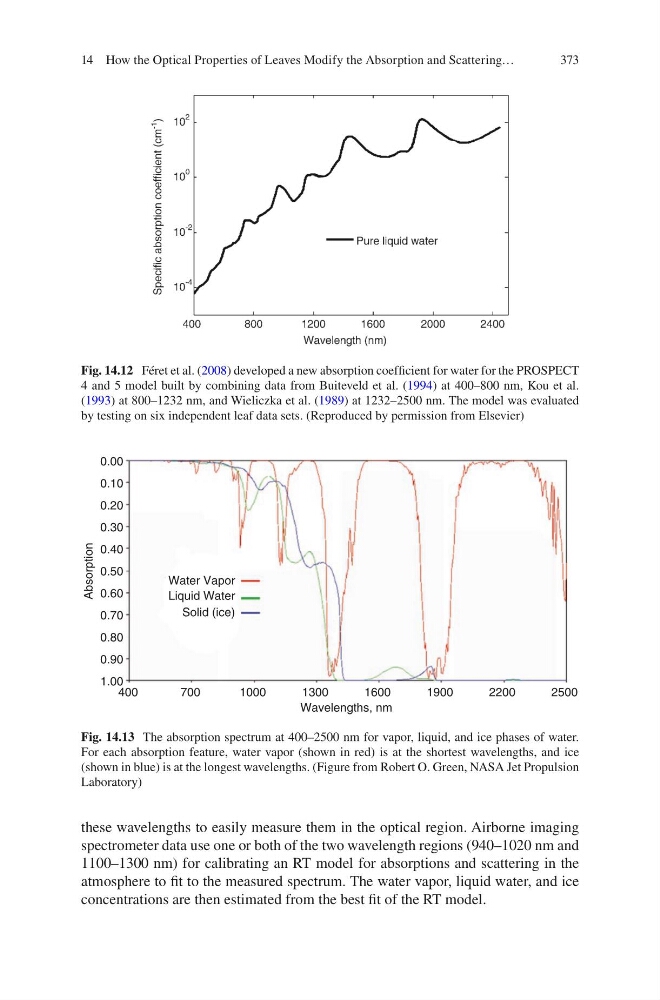
Fig. 14.12 Féret et al. (2008) developed a new absorption coefficient for water for the PROSPECT
4 and 5 model built by combining data from Buiteveld et al. (1994) at 400–800 nm, Kou et al.
(1993) at 800–1232 nm, and Wieliczka et al. (1989) at 1232–2500 nm. The model was evaluated
by testing on six independent leaf data sets. (Reproduced by permission from Elsevier)
1.00
0.90
0.80
0.70
0.60
0.50
Water Vapor
Absorption
Liquid Water
Solid (ice)
400
700
1000
1300
Wavelengths, nm
1600
1900
2200
2500
0.40
0.30
0.20
0.10
0.00
Fig. 14.13 The absorption spectrum at 400–2500 nm for vapor, liquid, and ice phases of water.
For each absorption feature, water vapor (shown in red) is at the shortest wavelengths, and ice
(shown in blue) is at the longest wavelengths. (Figure from Robert O. Green, NASA Jet Propulsion
Laboratory)
14 How the Optical Properties of Leaves Modify the Absorption and Scattering…
these wavelengths to easily measure them in the optical region. Airborne imaging
spectrometer data use one or both of the two wavelength regions (940–1020 nm and
1100–1300 nm) for calibrating an RT model for absorptions and scattering in the
atmosphere to fit to the measured spectrum. The water vapor, liquid water, and ice
concentrations are then estimated from the best fit of the RT model.
Fig. 14.12 Féret et al. (2008) developed a new absorption coefficient for water for the PROSPECT
4 and 5 model built by combining data from Buiteveld et al. (1994) at 400–800 nm, Kou et al.
(1993) at 800–1232 nm, and Wieliczka et al. (1989) at 1232–2500 nm. The model was evaluated
by testing on six independent leaf data sets. (Reproduced by permission from Elsevier)
1.00
0.90
0.80
0.70
0.60
0.50
Water Vapor
Absorption
Liquid Water
Solid (ice)
400
700
1000
1300
Wavelengths, nm
1600
1900
2200
2500
0.40
0.30
0.20
0.10
0.00
Fig. 14.13 The absorption spectrum at 400–2500 nm for vapor, liquid, and ice phases of water.
For each absorption feature, water vapor (shown in red) is at the shortest wavelengths, and ice
(shown in blue) is at the longest wavelengths. (Figure from Robert O. Green, NASA Jet Propulsion
Laboratory)
14 How the Optical Properties of Leaves Modify the Absorption and Scattering…