

17
These observations led to the generalization that richness (number of species, S)
increases with available land area (A), giving rise to the well-known species-area
relationships, in which the log of species number increases linearly with the log of
the area available:
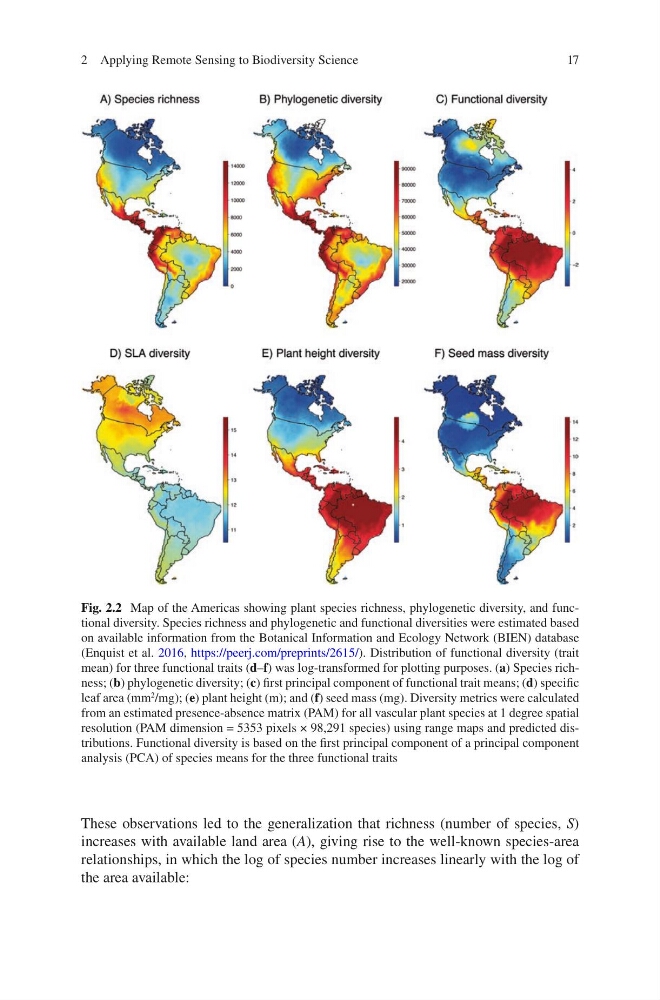
Fig. 2.2 Map of the Americas showing plant species richness, phylogenetic diversity, and functional diversity. Species richness and phylogenetic and functional diversities were estimated based
on available information from the Botanical Information and Ecology Network (BIEN) database
(Enquist et al. 2016, https://peerj.com/preprints/2615/). Distribution of functional diversity (trait
mean) for three functional traits (d–f) was log-transformed for plotting purposes. (a) Species richness; (b) phylogenetic diversity; (c) first principal component of functional trait means; (d) specific
leaf area (mm
2
/mg); (e) plant height (m); and (f) seed mass (mg). Diversity metrics were calculated
from an estimated presence-absence matrix (PAM) for all vascular plant species at 1 degree spatial
resolution (PAM dimension = 5353 pixels × 98,291 species) using range maps and predicted distributions. Functional diversity is based on the first principal component of a principal component
analysis (PCA) of species means for the three functional traits
2 Applying Remote Sensing to Biodiversity Science
These observations led to the generalization that richness (number of species, S)
increases with available land area (A), giving rise to the well-known species-area
relationships, in which the log of species number increases linearly with the log of
the area available:
Fig. 2.2 Map of the Americas showing plant species richness, phylogenetic diversity, and functional diversity. Species richness and phylogenetic and functional diversities were estimated based
on available information from the Botanical Information and Ecology Network (BIEN) database
(Enquist et al. 2016, https://peerj.com/preprints/2615/). Distribution of functional diversity (trait
mean) for three functional traits (d–f) was log-transformed for plotting purposes. (a) Species richness; (b) phylogenetic diversity; (c) first principal component of functional trait means; (d) specific
leaf area (mm
2
/mg); (e) plant height (m); and (f) seed mass (mg). Diversity metrics were calculated
from an estimated presence-absence matrix (PAM) for all vascular plant species at 1 degree spatial
resolution (PAM dimension = 5353 pixels × 98,291 species) using range maps and predicted distributions. Functional diversity is based on the first principal component of a principal component
analysis (PCA) of species means for the three functional traits
2 Applying Remote Sensing to Biodiversity Science