

323
13.2.2.3 Thermal RS
Thermal RS detects the energy emitted from Earth’s surface as electromagnetic
radiation in the thermal infrared spectral range (TIR, 3–15 μm). This energy can be
radiated by all bodies with a temperature above absolute zero and is dependent on
the surface temperature and the thermal properties (emissivity) of the observed target (Kuenzer et al. 2013; Künzer and Dech 2013).
Land surface temperature (LST) is one of the most important state variables
representing the coupled interaction of the surface energy and water balance from
local to global scale (e.g., Kustas et al. 2003). LST is highly influenced by the radiative, thermal, and hydraulic properties of the soil-plant-atmosphere system and has
therefore been recognized as one of the high-priority parameters of the International
Geosphere and Biosphere Program (IGBP, Townshend et al. 1994).
Various RS platforms and sensors currently provide TIR data at different spatial,
spectral, and temporal resolutions. The most common include the Advanced Very
High Resolution Radiometer (AVHRR) onboard the Polar Orbiting Environmental
Satellites (POES); Landsat 5, 7, and 8; the MODIS sensor on board the NASA Terra
and Aqua satellite, the Advanced Spaceborne Thermal Emission and Reflection
Radiometer (ASTER) on the Terra Earth observing satellite platform; and Sea and
Land Surface Temperature Radiometer (SLSTR) onboard the Sentinel-3 mission.
Although LST is rarely used by ecologists (Wang et al. 2010), a number of applications are closely linked to understanding landscape and biodiversity characteristics. Most often, LST is taken as source to estimate evapotranspiration (see Krajewski
et al. 2006 for a review). LST is highly controlled by atmospheric conditions, but
also by stomata conductance and plant-available soil moisture (Bonan 2008). In this
sense, monitoring of LST with sufficiently high spatial and temporal resolution is
able to provide valuable information about the water and energy exchange between
the soil-plant-atmosphere continuum and related photosynthetic activities of the
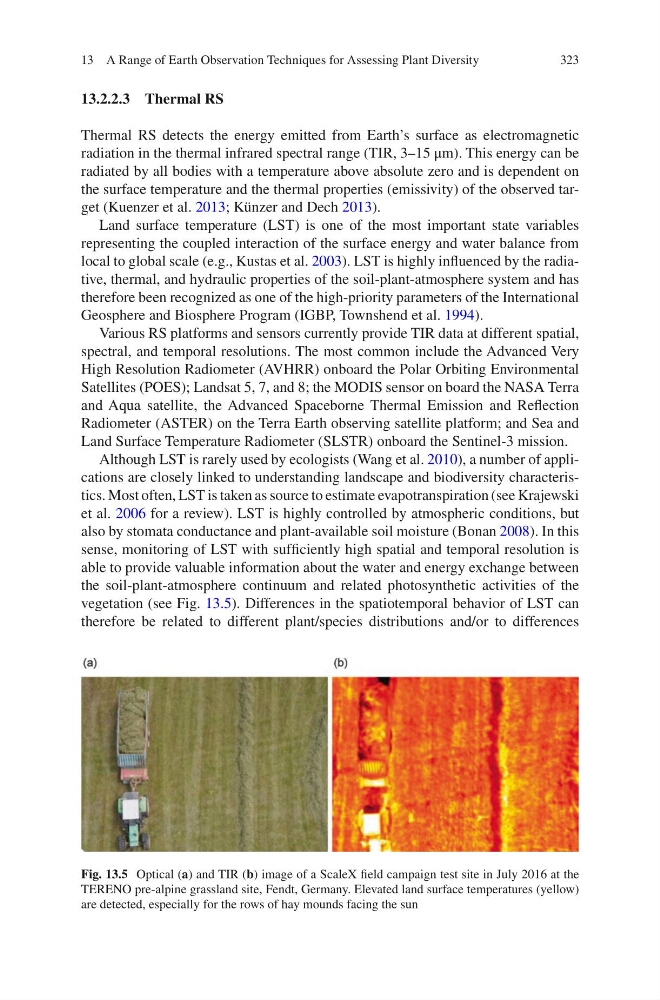
vegetation (see Fig. 13.5). Differences in the spatiotemporal behavior of LST can
therefore be related to different plant/species distributions and/or to differences
Fig. 13.5 Optical (a) and TIR (b) image of a ScaleX field campaign test site in July 2016 at the
TERENO pre-alpine grassland site, Fendt, Germany. Elevated land surface temperatures (yellow)
are detected, especially for the rows of hay mounds facing the sun
13 A Range of Earth Observation Techniques for Assessing Plant Diversity
13.2.2.3 Thermal RS
Thermal RS detects the energy emitted from Earth’s surface as electromagnetic
radiation in the thermal infrared spectral range (TIR, 3–15 μm). This energy can be
radiated by all bodies with a temperature above absolute zero and is dependent on
the surface temperature and the thermal properties (emissivity) of the observed target (Kuenzer et al. 2013; Künzer and Dech 2013).
Land surface temperature (LST) is one of the most important state variables
representing the coupled interaction of the surface energy and water balance from
local to global scale (e.g., Kustas et al. 2003). LST is highly influenced by the radiative, thermal, and hydraulic properties of the soil-plant-atmosphere system and has
therefore been recognized as one of the high-priority parameters of the International
Geosphere and Biosphere Program (IGBP, Townshend et al. 1994).
Various RS platforms and sensors currently provide TIR data at different spatial,
spectral, and temporal resolutions. The most common include the Advanced Very
High Resolution Radiometer (AVHRR) onboard the Polar Orbiting Environmental
Satellites (POES); Landsat 5, 7, and 8; the MODIS sensor on board the NASA Terra
and Aqua satellite, the Advanced Spaceborne Thermal Emission and Reflection
Radiometer (ASTER) on the Terra Earth observing satellite platform; and Sea and
Land Surface Temperature Radiometer (SLSTR) onboard the Sentinel-3 mission.
Although LST is rarely used by ecologists (Wang et al. 2010), a number of applications are closely linked to understanding landscape and biodiversity characteristics. Most often, LST is taken as source to estimate evapotranspiration (see Krajewski
et al. 2006 for a review). LST is highly controlled by atmospheric conditions, but
also by stomata conductance and plant-available soil moisture (Bonan 2008). In this
sense, monitoring of LST with sufficiently high spatial and temporal resolution is
able to provide valuable information about the water and energy exchange between
the soil-plant-atmosphere continuum and related photosynthetic activities of the
vegetation (see Fig. 13.5). Differences in the spatiotemporal behavior of LST can
therefore be related to different plant/species distributions and/or to differences
Fig. 13.5 Optical (a) and TIR (b) image of a ScaleX field campaign test site in July 2016 at the
TERENO pre-alpine grassland site, Fendt, Germany. Elevated land surface temperatures (yellow)
are detected, especially for the rows of hay mounds facing the sun
13 A Range of Earth Observation Techniques for Assessing Plant Diversity