

322
distance increases, using all pairwise distances among N plots, based on an a priori
defined statistical sampling design.
Another powerful method to estimate beta diversity is related to the so-called
spectral species concept (Féret and Asner 2014). This approach is based on the preliminary unsupervised clustering of spectral data, assigning each pixel to a “spectral
species.” After spectral clustering, the image is divided into homogeneous elementary surface units, and a dissimilarity metric is then used to compute pairwise dissimilarity between each pair of surface units. Finally, the resulting dissimilarity
matrix is processed using nonmetric multidimensional scaling to project elementary
units in a 3-D Euclidean space, allowing the creation of a map in the standard redgreen- blue (RGB) color system. Such a map expresses changes in species composition with changes in color or color intensity.
While the previously described methods are powerful in describing and estimating diversity from space, they are mainly related to spectral heterogeneity measurement, with no direct relationship with drivers of diversity, such as climate drivers,
which might be better estimated by thermal RS.
A very important milestone in biodiversity research was the development of
plant functional types (PFTs) such as the Ellenberg indicator values (Schmidtlein
2005) or the CSR-strategy types (C, competitive species; S, stress-tolerant species;
R, ruderal species), which altered their functional traits as a consequence of the
adaptation to changes in abiotic conditions and/or human pressures such as land-use
intensity or management practices. Schmidtlein et al. (2012) developed the foundations for linking RS with this biodiversity concept. Rocchini et al. (2018a) used this
research as a basis for calculating a global biodiversity index, namely, “Rao’s Q.”
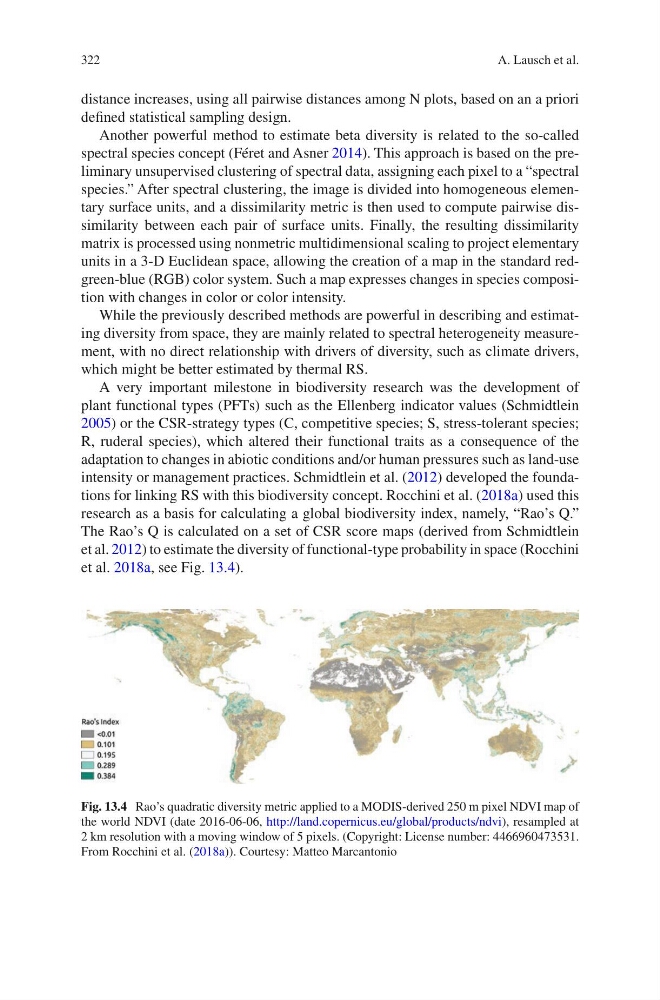
The Rao’s Q is calculated on a set of CSR score maps (derived from Schmidtlein
et al. 2012) to estimate the diversity of functional-type probability in space (Rocchini
et al. 2018a, see Fig. 13.4).
Fig. 13.4 Rao’s quadratic diversity metric applied to a MODIS-derived 250 m pixel NDVI map of
the world NDVI (date 2016-06-06, http://land.copernicus.eu/global/products/ndvi), resampled at
2 km resolution with a moving window of 5 pixels. (Copyright: License number: 4466960473531.
From Rocchini et al. (2018a)). Courtesy: Matteo Marcantonio
A. Lausch et al.
distance increases, using all pairwise distances among N plots, based on an a priori
defined statistical sampling design.
Another powerful method to estimate beta diversity is related to the so-called
spectral species concept (Féret and Asner 2014). This approach is based on the preliminary unsupervised clustering of spectral data, assigning each pixel to a “spectral
species.” After spectral clustering, the image is divided into homogeneous elementary surface units, and a dissimilarity metric is then used to compute pairwise dissimilarity between each pair of surface units. Finally, the resulting dissimilarity
matrix is processed using nonmetric multidimensional scaling to project elementary
units in a 3-D Euclidean space, allowing the creation of a map in the standard redgreen- blue (RGB) color system. Such a map expresses changes in species composition with changes in color or color intensity.
While the previously described methods are powerful in describing and estimating diversity from space, they are mainly related to spectral heterogeneity measurement, with no direct relationship with drivers of diversity, such as climate drivers,
which might be better estimated by thermal RS.
A very important milestone in biodiversity research was the development of
plant functional types (PFTs) such as the Ellenberg indicator values (Schmidtlein
2005) or the CSR-strategy types (C, competitive species; S, stress-tolerant species;
R, ruderal species), which altered their functional traits as a consequence of the
adaptation to changes in abiotic conditions and/or human pressures such as land-use
intensity or management practices. Schmidtlein et al. (2012) developed the foundations for linking RS with this biodiversity concept. Rocchini et al. (2018a) used this
research as a basis for calculating a global biodiversity index, namely, “Rao’s Q.”
The Rao’s Q is calculated on a set of CSR score maps (derived from Schmidtlein
et al. 2012) to estimate the diversity of functional-type probability in space (Rocchini
et al. 2018a, see Fig. 13.4).
Fig. 13.4 Rao’s quadratic diversity metric applied to a MODIS-derived 250 m pixel NDVI map of
the world NDVI (date 2016-06-06, http://land.copernicus.eu/global/products/ndvi), resampled at
2 km resolution with a moving window of 5 pixels. (Copyright: License number: 4466960473531.
From Rocchini et al. (2018a)). Courtesy: Matteo Marcantonio
A. Lausch et al.