

163
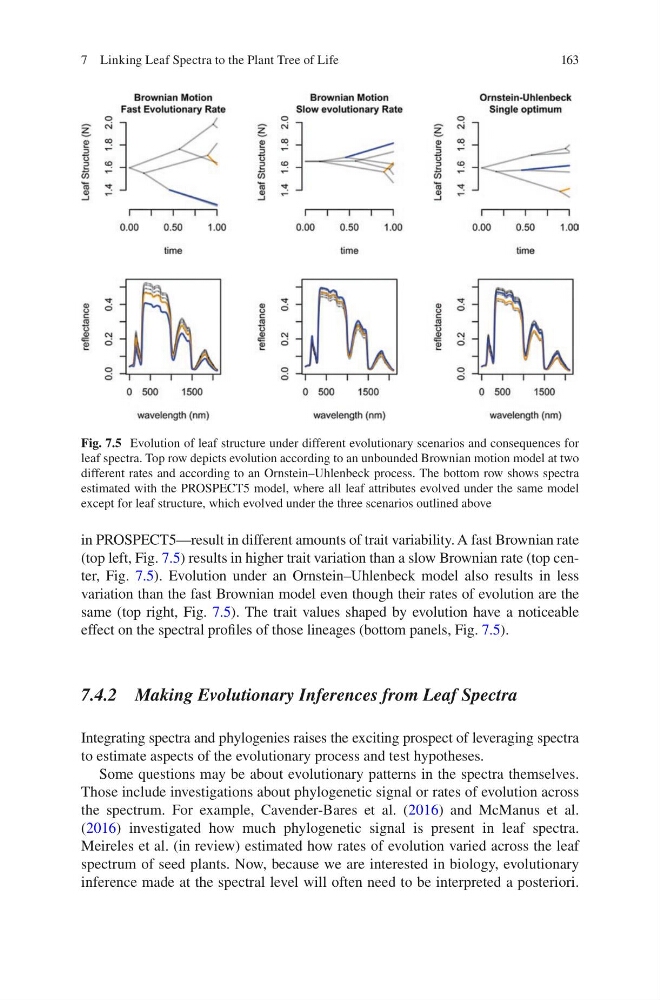
in PROSPECT5—result in different amounts of trait variability. A fast Brownian rate
(top left, Fig. 7.5) results in higher trait variation than a slow Brownian rate (top center, Fig. 7.5). Evolution under an Ornstein–Uhlenbeck model also results in less
variation than the fast Brownian model even though their rates of evolution are the
same (top right, Fig. 7.5). The trait values shaped by evolution have a noticeable
effect on the spectral profiles of those lineages (bottom panels, Fig. 7.5).
7.4.2 Making Evolutionary Inferences from Leaf Spectra
Integrating spectra and phylogenies raises the exciting prospect of leveraging spectra
to estimate aspects of the evolutionary process and test hypotheses.
Some questions may be about evolutionary patterns in the spectra themselves.
Those include investigations about phylogenetic signal or rates of evolution across
the spectrum. For example, Cavender-Bares et al. (2016) and McManus et al.
(2016) investigated how much phylogenetic signal is present in leaf spectra.
Meireles et al. (in review) estimated how rates of evolution varied across the leaf
spectrum of seed plants. Now, because we are interested in biology, evolutionary
inference made at the spectral level will often need to be interpreted a posteriori.
Fig. 7.5 Evolution of leaf structure under different evolutionary scenarios and consequences for
leaf spectra. Top row depicts evolution according to an unbounded Brownian motion model at two
different rates and according to an Ornstein–Uhlenbeck process. The bottom row shows spectra
estimated with the PROSPECT5 model, where all leaf attributes evolved under the same model
except for leaf structure, which evolved under the three scenarios outlined above
7 Linking Leaf Spectra to the Plant Tree of Life
in PROSPECT5—result in different amounts of trait variability. A fast Brownian rate
(top left, Fig. 7.5) results in higher trait variation than a slow Brownian rate (top center, Fig. 7.5). Evolution under an Ornstein–Uhlenbeck model also results in less
variation than the fast Brownian model even though their rates of evolution are the
same (top right, Fig. 7.5). The trait values shaped by evolution have a noticeable
effect on the spectral profiles of those lineages (bottom panels, Fig. 7.5).
7.4.2 Making Evolutionary Inferences from Leaf Spectra
Integrating spectra and phylogenies raises the exciting prospect of leveraging spectra
to estimate aspects of the evolutionary process and test hypotheses.
Some questions may be about evolutionary patterns in the spectra themselves.
Those include investigations about phylogenetic signal or rates of evolution across
the spectrum. For example, Cavender-Bares et al. (2016) and McManus et al.
(2016) investigated how much phylogenetic signal is present in leaf spectra.
Meireles et al. (in review) estimated how rates of evolution varied across the leaf
spectrum of seed plants. Now, because we are interested in biology, evolutionary
inference made at the spectral level will often need to be interpreted a posteriori.
Fig. 7.5 Evolution of leaf structure under different evolutionary scenarios and consequences for
leaf spectra. Top row depicts evolution according to an unbounded Brownian motion model at two
different rates and according to an Ornstein–Uhlenbeck process. The bottom row shows spectra
estimated with the PROSPECT5 model, where all leaf attributes evolved under the same model
except for leaf structure, which evolved under the three scenarios outlined above
7 Linking Leaf Spectra to the Plant Tree of Life