

161
shape across all flowering plants does not imply the lack of phylogenetic signal in
fruit shape within the oaks. Therefore, assessments of phylogenetic signal should
be seen as indicators that are contingent on the scale of analysis and the particular
species sampled instead of as general, hard truths.
It is also important to recognize that every calculation of the phylogenetic signal
of a trait involves fitting an evolutionary model that comes with a series of assumptions. For example, most procedures to estimate phylogenetic signal using
Blomberg’s K are based on a single-rate Brownian motion model; using and reporting the measure of phylogenetic signal implicitly requires accepting the Brownian
assumptions.
7.4 Evolution and Spectra
Chemical and structural leaf attributes that underlie plant spectra evolve through
time. Because leaf spectra integrate over these evolved leaf attributes, they can carry
information about phylogenetic relationships and leaf evolution. Given this, how
would one go about analyzing spectra in a phylogenetic context?
One approach is to subject the spectra directly to an evolutionary analysis, essentially taking reflectance values at different bands across the spectrum to be a set of
“traits.” For example, McManus et al. (2016) estimated Pagel’s lambda on spectra
from Amazonian plants, assuming each band to be an independent trait. CavenderBares et al. (2016) used principal component analysis (PCA) to reduce the dimensionality of the spectral data before estimating phylogenetic signal on the resulting
principal component axes using Blomberg’s K.
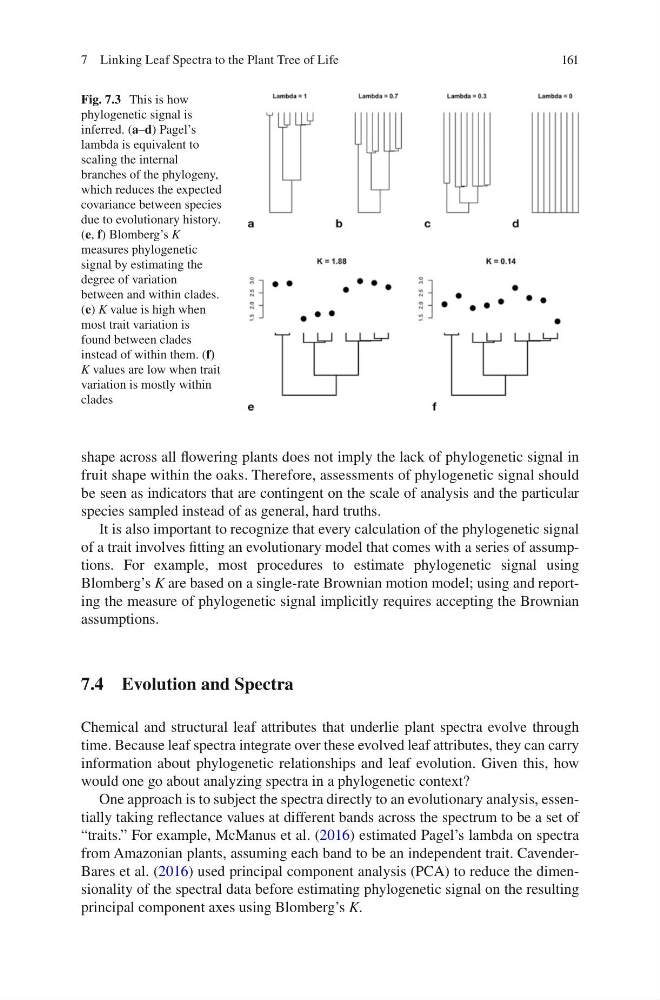
Fig. 7.3 This is how
phylogenetic signal is
inferred. (a–d) Pagel’s
lambda is equivalent to
scaling the internal
branches of the phylogeny,
which reduces the expected
covariance between species
due to evolutionary history.
(e, f) Blomberg’s K
measures phylogenetic
signal by estimating the
degree of variation
between and within clades.
(e) K value is high when
most trait variation is
found between clades
instead of within them. (f)
K values are low when trait
variation is mostly within
clades
7 Linking Leaf Spectra to the Plant Tree of Life
shape across all flowering plants does not imply the lack of phylogenetic signal in
fruit shape within the oaks. Therefore, assessments of phylogenetic signal should
be seen as indicators that are contingent on the scale of analysis and the particular
species sampled instead of as general, hard truths.
It is also important to recognize that every calculation of the phylogenetic signal
of a trait involves fitting an evolutionary model that comes with a series of assumptions. For example, most procedures to estimate phylogenetic signal using
Blomberg’s K are based on a single-rate Brownian motion model; using and reporting the measure of phylogenetic signal implicitly requires accepting the Brownian
assumptions.
7.4 Evolution and Spectra
Chemical and structural leaf attributes that underlie plant spectra evolve through
time. Because leaf spectra integrate over these evolved leaf attributes, they can carry
information about phylogenetic relationships and leaf evolution. Given this, how
would one go about analyzing spectra in a phylogenetic context?
One approach is to subject the spectra directly to an evolutionary analysis, essentially taking reflectance values at different bands across the spectrum to be a set of
“traits.” For example, McManus et al. (2016) estimated Pagel’s lambda on spectra
from Amazonian plants, assuming each band to be an independent trait. CavenderBares et al. (2016) used principal component analysis (PCA) to reduce the dimensionality of the spectral data before estimating phylogenetic signal on the resulting
principal component axes using Blomberg’s K.
Fig. 7.3 This is how
phylogenetic signal is
inferred. (a–d) Pagel’s
lambda is equivalent to
scaling the internal
branches of the phylogeny,
which reduces the expected
covariance between species
due to evolutionary history.
(e, f) Blomberg’s K
measures phylogenetic
signal by estimating the
degree of variation
between and within clades.
(e) K value is high when
most trait variation is
found between clades
instead of within them. (f)
K values are low when trait
variation is mostly within
clades
7 Linking Leaf Spectra to the Plant Tree of Life