

108
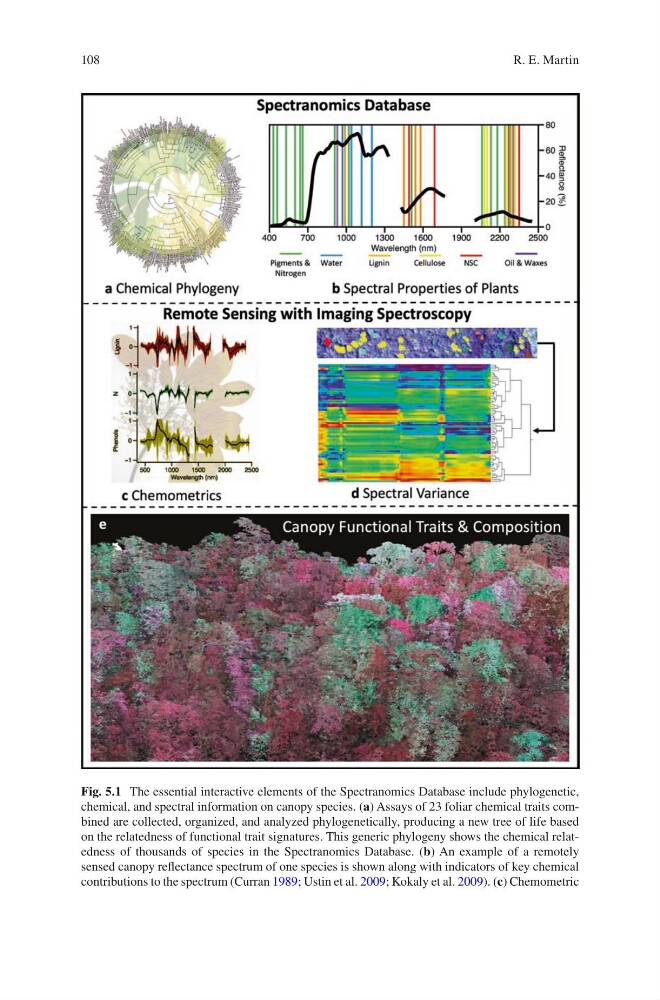
Fig. 5.1 The essential interactive elements of the Spectranomics Database include phylogenetic,
chemical, and spectral information on canopy species. (a) Assays of 23 foliar chemical traits combined are collected, organized, and analyzed phylogenetically, producing a new tree of life based
on the relatedness of functional trait signatures. This generic phylogeny shows the chemical relatedness of thousands of species in the Spectranomics Database. (b) An example of a remotely
sensed canopy reflectance spectrum of one species is shown along with indicators of key chemical
contributions to the spectrum (Curran 1989; Ustin et al. 2009; Kokaly et al. 2009). (c) Chemometric
R. E. Martin
Fig. 5.1 The essential interactive elements of the Spectranomics Database include phylogenetic,
chemical, and spectral information on canopy species. (a) Assays of 23 foliar chemical traits combined are collected, organized, and analyzed phylogenetically, producing a new tree of life based
on the relatedness of functional trait signatures. This generic phylogeny shows the chemical relatedness of thousands of species in the Spectranomics Database. (b) An example of a remotely
sensed canopy reflectance spectrum of one species is shown along with indicators of key chemical
contributions to the spectrum (Curran 1989; Ustin et al. 2009; Kokaly et al. 2009). (c) Chemometric
R. E. Martin