

107
bohydrates); (ii) are related to structure (leaf mass per area and water content, lignin, cellulose, and hemicellulose) and chemical defense (phenols and tannins); and
(iii) are defining general metabolic processes (macro- and micronutrients; here calcium, magnesium, phosphorus, potassium and boron, iron, manganese, zinc)
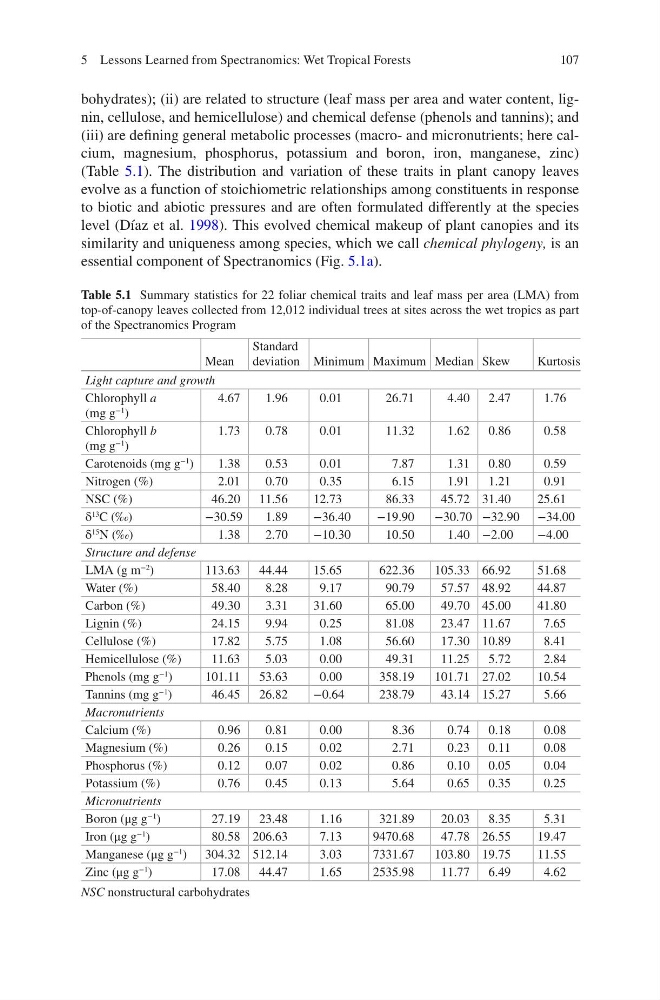
(Table 5.1). The distribution and variation of these traits in plant canopy leaves
evolve as a function of stoichiometric relationships among constituents in response
to biotic and abiotic pressures and are often formulated differently at the species
level (Díaz et al. 1998). This evolved chemical makeup of plant canopies and its
similarity and uniqueness among species, which we call chemical phylogeny, is an
essential component of Spectranomics (Fig. 5.1a).
Table 5.1 Summary statistics for 22 foliar chemical traits and leaf mass per area (LMA) from
top-of-canopy leaves collected from 12,012 individual trees at sites across the wet tropics as part
of the Spectranomics Program
Mean
Standard
deviation Minimum Maximum Median Skew
Kurtosis
Light capture and growth
Chlorophyll a
(mg g
−1 )
4.67
1.96
0.01
26.71
4.40 2.47
1.76
Chlorophyll b
(mg g
−1 )
1.73
0.78
0.01
11.32
1.62 0.86
0.58
Carotenoids (mg g
−1 )
1.38
0.53
0.01
7.87
1.31 0.80
0.59
Nitrogen (%)
2.01
0.70
0.35
6.15
1.91 1.21
0.91
NSC (%)
46.20 11.56
12.73
86.33
45.72 31.40
25.61
δ
13
C (‰)
−30.59
1.89
−36.40
−19.90
−30.70 −32.90 −34.00
δ
15
N (‰)
1.38
2.70
−10.30
10.50
1.40 −2.00
−4.00
Structure and defense
LMA (g m
−2
)
113.63 44.44
15.65
622.36
105.33 66.92
51.68
Water (%)
58.40
8.28
9.17
90.79
57.57 48.92
44.87
Carbon (%)
49.30
3.31
31.60
65.00
49.70 45.00
41.80
Lignin (%)
24.15
9.94
0.25
81.08
23.47 11.67
7.65
Cellulose (%)
17.82
5.75
1.08
56.60
17.30 10.89
8.41
Hemicellulose (%)
11.63
5.03
0.00
49.31
11.25 5.72
2.84
Phenols (mg g
−1
)
101.11 53.63
0.00
358.19
101.71 27.02
10.54
Tannins (mg g
−1
)
46.45 26.82
−0.64
238.79
43.14 15.27
5.66
Macronutrients
Calcium (%)
0.96
0.81
0.00
8.36
0.74 0.18
0.08
Magnesium (%)
0.26
0.15
0.02
2.71
0.23 0.11
0.08
Phosphorus (%)
0.12
0.07
0.02
0.86
0.10 0.05
0.04
Potassium (%)
0.76
0.45
0.13
5.64
0.65 0.35
0.25
Micronutrients
Boron (μg g
−1 )
27.19 23.48
1.16
321.89
20.03 8.35
5.31
Iron (μg g
−1
)
80.58 206.63
7.13
9470.68
47.78 26.55
19.47
Manganese (μg g
−1 ) 304.32 512.14
3.03
7331.67
103.80 19.75
11.55
Zinc (μg g
−1 )
17.08 44.47
1.65
2535.98
11.77 6.49
4.62
NSC nonstructural carbohydrates
5 Lessons Learned from Spectranomics: Wet Tropical Forests
bohydrates); (ii) are related to structure (leaf mass per area and water content, lignin, cellulose, and hemicellulose) and chemical defense (phenols and tannins); and
(iii) are defining general metabolic processes (macro- and micronutrients; here calcium, magnesium, phosphorus, potassium and boron, iron, manganese, zinc)
(Table 5.1). The distribution and variation of these traits in plant canopy leaves
evolve as a function of stoichiometric relationships among constituents in response
to biotic and abiotic pressures and are often formulated differently at the species
level (Díaz et al. 1998). This evolved chemical makeup of plant canopies and its
similarity and uniqueness among species, which we call chemical phylogeny, is an
essential component of Spectranomics (Fig. 5.1a).
Table 5.1 Summary statistics for 22 foliar chemical traits and leaf mass per area (LMA) from
top-of-canopy leaves collected from 12,012 individual trees at sites across the wet tropics as part
of the Spectranomics Program
Mean
Standard
deviation Minimum Maximum Median Skew
Kurtosis
Light capture and growth
Chlorophyll a
(mg g
−1 )
4.67
1.96
0.01
26.71
4.40 2.47
1.76
Chlorophyll b
(mg g
−1 )
1.73
0.78
0.01
11.32
1.62 0.86
0.58
Carotenoids (mg g
−1 )
1.38
0.53
0.01
7.87
1.31 0.80
0.59
Nitrogen (%)
2.01
0.70
0.35
6.15
1.91 1.21
0.91
NSC (%)
46.20 11.56
12.73
86.33
45.72 31.40
25.61
δ
13
C (‰)
−30.59
1.89
−36.40
−19.90
−30.70 −32.90 −34.00
δ
15
N (‰)
1.38
2.70
−10.30
10.50
1.40 −2.00
−4.00
Structure and defense
LMA (g m
−2
)
113.63 44.44
15.65
622.36
105.33 66.92
51.68
Water (%)
58.40
8.28
9.17
90.79
57.57 48.92
44.87
Carbon (%)
49.30
3.31
31.60
65.00
49.70 45.00
41.80
Lignin (%)
24.15
9.94
0.25
81.08
23.47 11.67
7.65
Cellulose (%)
17.82
5.75
1.08
56.60
17.30 10.89
8.41
Hemicellulose (%)
11.63
5.03
0.00
49.31
11.25 5.72
2.84
Phenols (mg g
−1
)
101.11 53.63
0.00
358.19
101.71 27.02
10.54
Tannins (mg g
−1
)
46.45 26.82
−0.64
238.79
43.14 15.27
5.66
Macronutrients
Calcium (%)
0.96
0.81
0.00
8.36
0.74 0.18
0.08
Magnesium (%)
0.26
0.15
0.02
2.71
0.23 0.11
0.08
Phosphorus (%)
0.12
0.07
0.02
0.86
0.10 0.05
0.04
Potassium (%)
0.76
0.45
0.13
5.64
0.65 0.35
0.25
Micronutrients
Boron (μg g
−1 )
27.19 23.48
1.16
321.89
20.03 8.35
5.31
Iron (μg g
−1
)
80.58 206.63
7.13
9470.68
47.78 26.55
19.47
Manganese (μg g
−1 ) 304.32 512.14
3.03
7331.67
103.80 19.75
11.55
Zinc (μg g
−1 )
17.08 44.47
1.65
2535.98
11.77 6.49
4.62
NSC nonstructural carbohydrates
5 Lessons Learned from Spectranomics: Wet Tropical Forests