

91
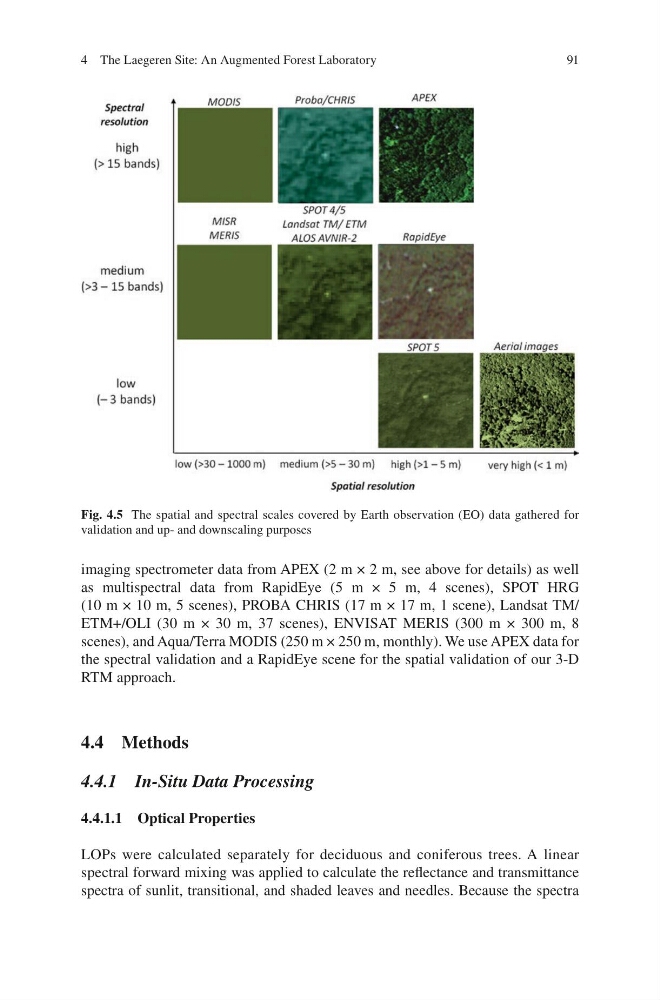
imaging spectrometer data from APEX (2 m × 2 m, see above for details) as well
as multispectral data from RapidEye (5 m × 5 m, 4 scenes), SPOT HRG
(10 m × 10 m, 5 scenes), PROBA CHRIS (17 m × 17 m, 1 scene), Landsat TM/
ETM+/OLI (30 m × 30 m, 37 scenes), ENVISAT MERIS (300 m × 300 m, 8
scenes), and Aqua/Terra MODIS (250 m × 250 m, monthly). We use APEX data for
the spectral validation and a RapidEye scene for the spatial validation of our 3-D
RTM approach.
4.4 Methods
4.4.1 In-Situ Data Processing
4.4.1.1 Optical Properties
LOPs were calculated separately for deciduous and coniferous trees. A linear
spectral forward mixing was applied to calculate the reflectance and transmittance
spectra of sunlit, transitional, and shaded leaves and needles. Because the spectra
Fig. 4.5 The spatial and spectral scales covered by Earth observation (EO) data gathered for
validation and up- and downscaling purposes
4 The Laegeren Site: An Augmented Forest Laboratory
imaging spectrometer data from APEX (2 m × 2 m, see above for details) as well
as multispectral data from RapidEye (5 m × 5 m, 4 scenes), SPOT HRG
(10 m × 10 m, 5 scenes), PROBA CHRIS (17 m × 17 m, 1 scene), Landsat TM/
ETM+/OLI (30 m × 30 m, 37 scenes), ENVISAT MERIS (300 m × 300 m, 8
scenes), and Aqua/Terra MODIS (250 m × 250 m, monthly). We use APEX data for
the spectral validation and a RapidEye scene for the spatial validation of our 3-D
RTM approach.
4.4 Methods
4.4.1 In-Situ Data Processing
4.4.1.1 Optical Properties
LOPs were calculated separately for deciduous and coniferous trees. A linear
spectral forward mixing was applied to calculate the reflectance and transmittance
spectra of sunlit, transitional, and shaded leaves and needles. Because the spectra
Fig. 4.5 The spatial and spectral scales covered by Earth observation (EO) data gathered for
validation and up- and downscaling purposes
4 The Laegeren Site: An Augmented Forest Laboratory