

89
The point cloud was filtered to classify ground and vegetation points, and the ground
points were subsequently interpolated to a raster of 1 m resolution. For a detailed
description of the digital terrain model (DTM) generation, see Leiterer et al. (2013).
DTM accuracy was assessed using more than 500 TLS-measured road surface and
bare soil points (see Sect. 4.3.2.2), which were related to the national land survey
and resulted in a mean height uncertainty of about ±0.25 m. For each point of the
full point cloud, the height above ground was calculated by subtracting the interpolated DTM value from the corresponding echo height above sea level, providing the
vertical distance of the vegetation echoes to the terrain underneath.
4.3.2.2 Terrestrial Laser Scanning
On a subset of about 60 m × 60 m, a ground-based TLS survey was carried out using
a Riegl VZ1000 instrument. A total of 40 scans on 20 scan locations were taken
because each location had to be covered by two scans due to the VZ1000’s camera
scanning pattern (Morsdorf et al. 2018). About 50 reflective targets were placed
within the scene and later used for co-registration of the scans. For co-registering
RiSCAN Pro was used, and we used the ALS data to subsequently globally adjust
(rotate and translate) the unified TLS point cloud. Due to the high and dense canopy,
TLS needs to be complemented by laser data from above the canopy, providing
more information in the upper part, either by ALS or UAV-based laser scanners. For
biomass retrievals, the occlusion of upper canopy material in TLS data might be less
of a problem because stems generally taper off toward the top. However, if simulation of the radiative regime and subsequent comparison with EO data gathered with
a top-of-canopy perspective is the aim, TLS in denser forests needs to be complemented with laser scanning data from above the canopy (Morsdorf et al. 2017,
2018) (Fig. 4.4).
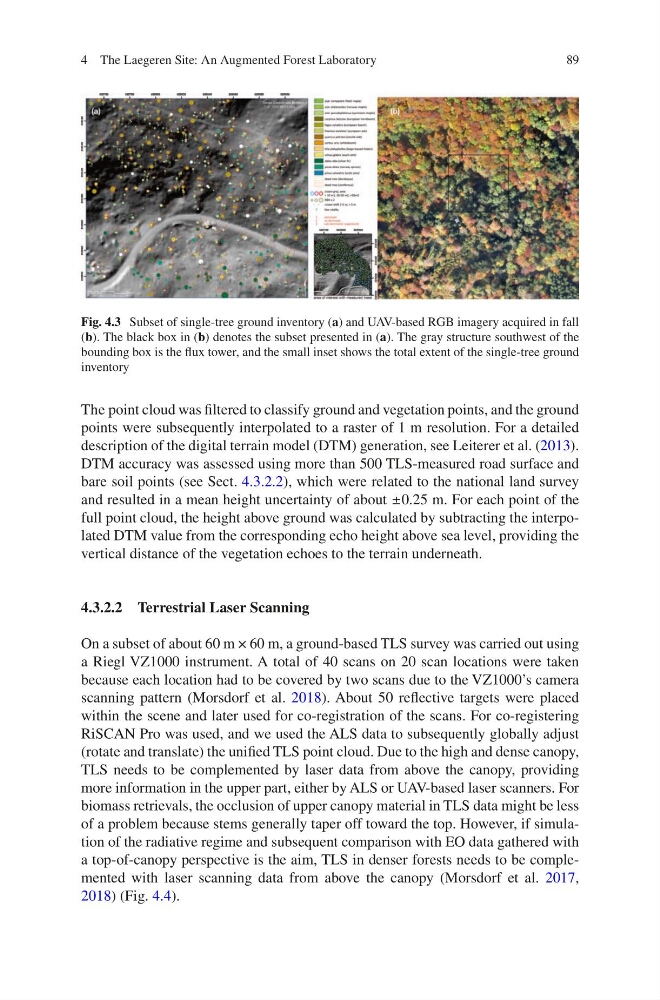
Fig. 4.3 Subset of single-tree ground inventory (a) and UAV-based RGB imagery acquired in fall
(b). The black box in (b) denotes the subset presented in (a). The gray structure southwest of the
bounding box is the flux tower, and the small inset shows the total extent of the single-tree ground
inventory
4 The Laegeren Site: An Augmented Forest Laboratory
The point cloud was filtered to classify ground and vegetation points, and the ground
points were subsequently interpolated to a raster of 1 m resolution. For a detailed
description of the digital terrain model (DTM) generation, see Leiterer et al. (2013).
DTM accuracy was assessed using more than 500 TLS-measured road surface and
bare soil points (see Sect. 4.3.2.2), which were related to the national land survey
and resulted in a mean height uncertainty of about ±0.25 m. For each point of the
full point cloud, the height above ground was calculated by subtracting the interpolated DTM value from the corresponding echo height above sea level, providing the
vertical distance of the vegetation echoes to the terrain underneath.
4.3.2.2 Terrestrial Laser Scanning
On a subset of about 60 m × 60 m, a ground-based TLS survey was carried out using
a Riegl VZ1000 instrument. A total of 40 scans on 20 scan locations were taken
because each location had to be covered by two scans due to the VZ1000’s camera
scanning pattern (Morsdorf et al. 2018). About 50 reflective targets were placed
within the scene and later used for co-registration of the scans. For co-registering
RiSCAN Pro was used, and we used the ALS data to subsequently globally adjust
(rotate and translate) the unified TLS point cloud. Due to the high and dense canopy,
TLS needs to be complemented by laser data from above the canopy, providing
more information in the upper part, either by ALS or UAV-based laser scanners. For
biomass retrievals, the occlusion of upper canopy material in TLS data might be less
of a problem because stems generally taper off toward the top. However, if simulation of the radiative regime and subsequent comparison with EO data gathered with
a top-of-canopy perspective is the aim, TLS in denser forests needs to be complemented with laser scanning data from above the canopy (Morsdorf et al. 2017,
2018) (Fig. 4.4).
Fig. 4.3 Subset of single-tree ground inventory (a) and UAV-based RGB imagery acquired in fall
(b). The black box in (b) denotes the subset presented in (a). The gray structure southwest of the
bounding box is the flux tower, and the small inset shows the total extent of the single-tree ground
inventory
4 The Laegeren Site: An Augmented Forest Laboratory