

These impurities were found in all three grades of TCB used: ‘TCB for synthesis’, redistilled TCB and the most expensive ‘TCB for HPLC’. The impurities in
TCB appear as residual solvent signals at about 1.18 ppm, 1.28 ppm, 2.15 ppm and
2.3 ppm. The signals of the solvent impurities partially overlap the signals of
polymer components. As depicted, much better information on the composition
of the sample components is obtained when corrected plots are used.
The blend components elute in the order of decreasing molar masses. The molar
mass of PMMA is the highest and it elutes first, followed by the intermediate molar
mass PE-PMMA copolymer and the lowest molar mass PE. The spectra of the early
eluting fractions show signals for PMMA but not for ethylene. In contrast, the late
eluting fractions exhibit signals for ethylene but not for MMA, and can be assigned
to PE. Between the two homopolymers, the elution of the copolymer can be
measured by detecting signals for both MMA and ethylene. Figure 3.7b also
shows the vertical projections taken from the sum of the
1 H-NMR signals. They
can be used as the chromatogram which also indicates three separated peaks.
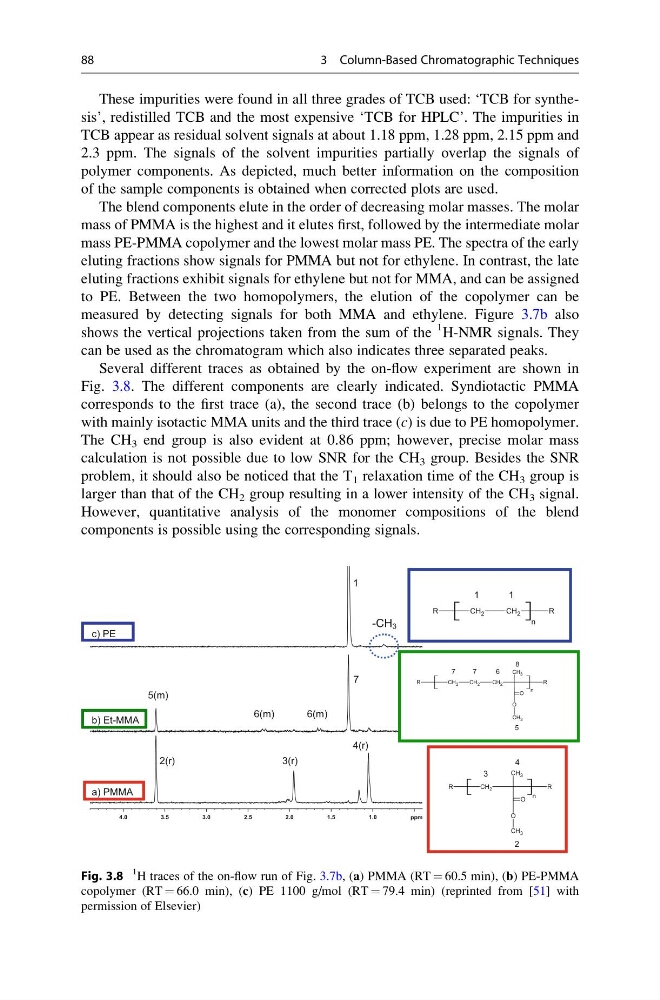
Several different traces as obtained by the on-flow experiment are shown in
Fig. 3.8. The different components are clearly indicated. Syndiotactic PMMA
corresponds to the first trace (a), the second trace (b) belongs to the copolymer
with mainly isotactic MMA units and the third trace (c) is due to PE homopolymer.
The CH 3 end group is also evident at 0.86 ppm; however, precise molar mass
calculation is not possible due to low SNR for the CH 3 group. Besides the SNR
problem, it should also be noticed that the T 1 relaxation time of the CH 3 group is
larger than that of the CH 2 group resulting in a lower intensity of the CH 3 signal.
However, quantitative analysis of the monomer compositions of the blend
components is possible using the corresponding signals.
1.0
1.5
2.0
2.5
3.0
3.5
4.0
ppm
c) PE
b) Et-MMA
a) PMMA
2(r)
3(r)
4(r)
5(m)
6(m)
6(m)
7
1
R
C H 2
CH 2
R
n
1
1
n
R
CH 2
CH 2
CH 2
R
CH 3
O
CH 3
O
5
8
7
7
6
n
R
C H 2
R
CH 3
O
CH 3
O
2
4
3
-CH 3
Fig. 3.8
1
H traces of the on-flow run of Fig. 3.7b, (a) PMMA (RT ¼ 60.5 min), (b) PE-PMMA
copolymer (RT ¼ 66.0 min), (c) PE 1100 g/mol (RT ¼ 79.4 min) (reprinted from [51] with
permission of Elsevier)
88
3 Column-Based Chromatographic Techniques
TCB appear as residual solvent signals at about 1.18 ppm, 1.28 ppm, 2.15 ppm and
2.3 ppm. The signals of the solvent impurities partially overlap the signals of
polymer components. As depicted, much better information on the composition
of the sample components is obtained when corrected plots are used.
The blend components elute in the order of decreasing molar masses. The molar
mass of PMMA is the highest and it elutes first, followed by the intermediate molar
mass PE-PMMA copolymer and the lowest molar mass PE. The spectra of the early
eluting fractions show signals for PMMA but not for ethylene. In contrast, the late
eluting fractions exhibit signals for ethylene but not for MMA, and can be assigned
to PE. Between the two homopolymers, the elution of the copolymer can be
measured by detecting signals for both MMA and ethylene. Figure 3.7b also
shows the vertical projections taken from the sum of the
1 H-NMR signals. They
can be used as the chromatogram which also indicates three separated peaks.
Several different traces as obtained by the on-flow experiment are shown in
Fig. 3.8. The different components are clearly indicated. Syndiotactic PMMA
corresponds to the first trace (a), the second trace (b) belongs to the copolymer
with mainly isotactic MMA units and the third trace (c) is due to PE homopolymer.
The CH 3 end group is also evident at 0.86 ppm; however, precise molar mass
calculation is not possible due to low SNR for the CH 3 group. Besides the SNR
problem, it should also be noticed that the T 1 relaxation time of the CH 3 group is
larger than that of the CH 2 group resulting in a lower intensity of the CH 3 signal.
However, quantitative analysis of the monomer compositions of the blend
components is possible using the corresponding signals.
1.0
1.5
2.0
2.5
3.0
3.5
4.0
ppm
c) PE
b) Et-MMA
a) PMMA
2(r)
3(r)
4(r)
5(m)
6(m)
6(m)
7
1
R
C H 2
CH 2
R
n
1
1
n
R
CH 2
CH 2
CH 2
R
CH 3
O
CH 3
O
5
8
7
7
6
n
R
C H 2
R
CH 3
O
CH 3
O
2
4
3
-CH 3
Fig. 3.8
1
H traces of the on-flow run of Fig. 3.7b, (a) PMMA (RT ¼ 60.5 min), (b) PE-PMMA
copolymer (RT ¼ 66.0 min), (c) PE 1100 g/mol (RT ¼ 79.4 min) (reprinted from [51] with
permission of Elsevier)
88
3 Column-Based Chromatographic Techniques