

T w ¼
Σc i Á T i
Σc i
T n ¼
Σc i
Σc i =T i
ð2:3Þ
σ ¼
ffiffiffiffiffiffiffiffiffiffiffiffiffiffiffiffiffiffiffiffiffiffiffiffiffiffiffi ffi
Σc i T
2
i À T
2
w
À
Á
Σc i
s
R ¼
T w
T n
À 1
Á 100
ð2:4Þ
2.2.1.5 Discussion and Evaluation
As is seen in Table 2.5, most of the copolymer samples exhibit narrow CCDs. This
makes them good candidates as calibration standards for CRYSTAF and TREF.
Such calibrations are required to relate the crystallization (or elution) temperature
to the comonomer content. For such copolymers, it is assumed that they are strictly
linear and do not have long chain branches. Based on comonomer contents,
analysed by
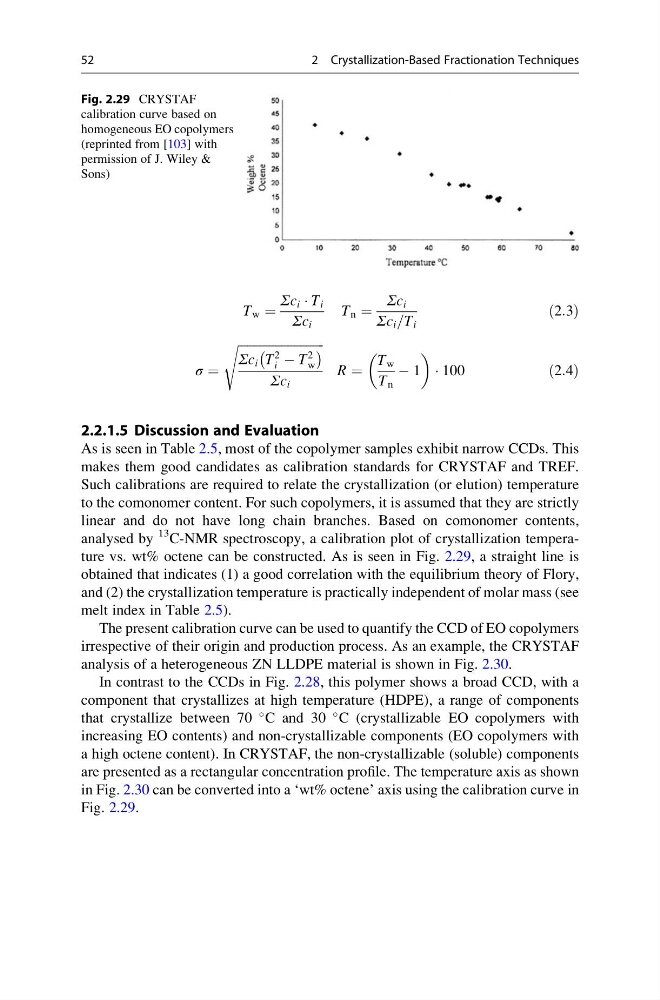
13 C-NMR spectroscopy, a calibration plot of crystallization temperature vs. wt% octene can be constructed. As is seen in Fig. 2.29, a straight line is
obtained that indicates (1) a good correlation with the equilibrium theory of Flory,
and (2) the crystallization temperature is practically independent of molar mass (see
melt index in Table 2.5).
The present calibration curve can be used to quantify the CCD of EO copolymers
irrespective of their origin and production process. As an example, the CRYSTAF
analysis of a heterogeneous ZN LLDPE material is shown in Fig. 2.30.
In contrast to the CCDs in Fig. 2.28, this polymer shows a broad CCD, with a
component that crystallizes at high temperature (HDPE), a range of components
that crystallize between 70
C and 30
C (crystallizable EO copolymers with
increasing EO contents) and non-crystallizable components (EO copolymers with
a high octene content). In CRYSTAF, the non-crystallizable (soluble) components
are presented as a rectangular concentration profile. The temperature axis as shown
in Fig. 2.30 can be converted into a ‘wt% octene’ axis using the calibration curve in
Fig. 2.29.
Fig. 2.29 CRYSTAF
calibration curve based on
homogeneous EO copolymers
(reprinted from [103] with
permission of J. Wiley &
Sons)
52
2 Crystallization-Based Fractionation Techniques
Σc i Á T i
Σc i
T n ¼
Σc i
Σc i =T i
ð2:3Þ
σ ¼
ffiffiffiffiffiffiffiffiffiffiffiffiffiffiffiffiffiffiffiffiffiffiffiffiffiffiffi ffi
Σc i T
2
i À T
2
w
À
Á
Σc i
s
R ¼
T w
T n
À 1
Á 100
ð2:4Þ
2.2.1.5 Discussion and Evaluation
As is seen in Table 2.5, most of the copolymer samples exhibit narrow CCDs. This
makes them good candidates as calibration standards for CRYSTAF and TREF.
Such calibrations are required to relate the crystallization (or elution) temperature
to the comonomer content. For such copolymers, it is assumed that they are strictly
linear and do not have long chain branches. Based on comonomer contents,
analysed by
13 C-NMR spectroscopy, a calibration plot of crystallization temperature vs. wt% octene can be constructed. As is seen in Fig. 2.29, a straight line is
obtained that indicates (1) a good correlation with the equilibrium theory of Flory,
and (2) the crystallization temperature is practically independent of molar mass (see
melt index in Table 2.5).
The present calibration curve can be used to quantify the CCD of EO copolymers
irrespective of their origin and production process. As an example, the CRYSTAF
analysis of a heterogeneous ZN LLDPE material is shown in Fig. 2.30.
In contrast to the CCDs in Fig. 2.28, this polymer shows a broad CCD, with a
component that crystallizes at high temperature (HDPE), a range of components
that crystallize between 70
C and 30
C (crystallizable EO copolymers with
increasing EO contents) and non-crystallizable components (EO copolymers with
a high octene content). In CRYSTAF, the non-crystallizable (soluble) components
are presented as a rectangular concentration profile. The temperature axis as shown
in Fig. 2.30 can be converted into a ‘wt% octene’ axis using the calibration curve in
Fig. 2.29.
Fig. 2.29 CRYSTAF
calibration curve based on
homogeneous EO copolymers
(reprinted from [103] with
permission of J. Wiley &
Sons)
52
2 Crystallization-Based Fractionation Techniques