

the comonomer type and content, the cooling rate and co-crystallization effects must
be taken into account for reliable CRYSTAF profiles, as is the case with TREF.
Comprehensive reviews on crystallization-based techniques summarize the state of
the art up to 2005 [12, 102]. More recent information is given in [9, 10].
As pointed out earlier, CRYSTAF was developed originally as a faster version of
crystallization fractionation and it was assumed that TREF and CRYSTAF would
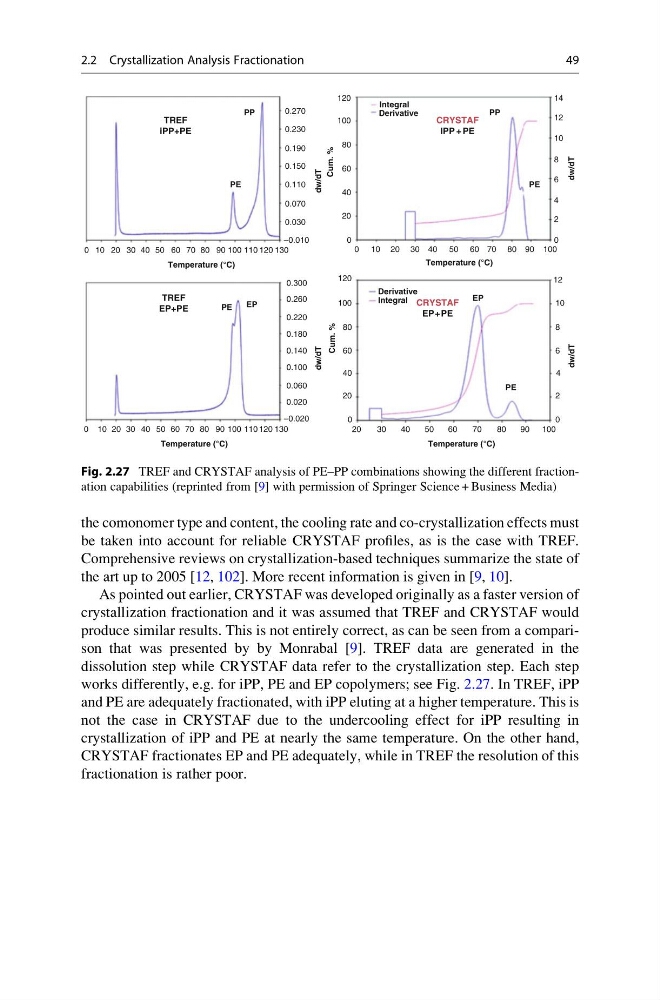
produce similar results. This is not entirely correct, as can be seen from a comparison that was presented by by Monrabal [9]. TREF data are generated in the
dissolution step while CRYSTAF data refer to the crystallization step. Each step
works differently, e.g. for iPP, PE and EP copolymers; see Fig. 2.27. In TREF, iPP
and PE are adequately fractionated, with iPP eluting at a higher temperature. This is
not the case in CRYSTAF due to the undercooling effect for iPP resulting in
crystallization of iPP and PE at nearly the same temperature. On the other hand,
CRYSTAF fractionates EP and PE adequately, while in TREF the resolution of this
fractionation is rather poor.
0 10 20 30 40 50 60 70 80
100 110 120 130
90
0 10 20 30 40 50 60 70 80
100 110 120 130
90
0
0
0
10 20
20
30 40
40
50 60
60
70 80
80
100
100
120
0
20
40
60
80
100
120
90
20
30
40
50
60
70
80
100
90
Temperature (°C)
Temperature (°C)
Temperature (°C)
Temperature (°C)
TREF
iPP+PE
TREF
EP+PE
PP
EP
EP
PP
PE
PE
PE
PE
0.270
0.230
0.190
0.150
0.110
0.070
0.030
–0.010
0.300
0.260
0.220
0.180
0.140
0.100
0.060
0.020
–0.020
Cum. %
Cum. %
2
4
6
6
8
10
12
14
dw/dT
0
2
4
8
10
12
dw/dT
dw/dT
dw/dT
CRYSTAF
IPP + PE
CRYSTAF
EP+PE
Integral
Integral
Derivative
Derivative
Fig. 2.27 TREF and CRYSTAF analysis of PE–PP combinations showing the different fractionation capabilities (reprinted from [9] with permission of Springer Science + Business Media)
2.2 Crystallization Analysis Fractionation
49
be taken into account for reliable CRYSTAF profiles, as is the case with TREF.
Comprehensive reviews on crystallization-based techniques summarize the state of
the art up to 2005 [12, 102]. More recent information is given in [9, 10].
As pointed out earlier, CRYSTAF was developed originally as a faster version of
crystallization fractionation and it was assumed that TREF and CRYSTAF would
produce similar results. This is not entirely correct, as can be seen from a comparison that was presented by by Monrabal [9]. TREF data are generated in the
dissolution step while CRYSTAF data refer to the crystallization step. Each step
works differently, e.g. for iPP, PE and EP copolymers; see Fig. 2.27. In TREF, iPP
and PE are adequately fractionated, with iPP eluting at a higher temperature. This is
not the case in CRYSTAF due to the undercooling effect for iPP resulting in
crystallization of iPP and PE at nearly the same temperature. On the other hand,
CRYSTAF fractionates EP and PE adequately, while in TREF the resolution of this
fractionation is rather poor.
0 10 20 30 40 50 60 70 80
100 110 120 130
90
0 10 20 30 40 50 60 70 80
100 110 120 130
90
0
0
0
10 20
20
30 40
40
50 60
60
70 80
80
100
100
120
0
20
40
60
80
100
120
90
20
30
40
50
60
70
80
100
90
Temperature (°C)
Temperature (°C)
Temperature (°C)
Temperature (°C)
TREF
iPP+PE
TREF
EP+PE
PP
EP
EP
PP
PE
PE
PE
PE
0.270
0.230
0.190
0.150
0.110
0.070
0.030
–0.010
0.300
0.260
0.220
0.180
0.140
0.100
0.060
0.020
–0.020
Cum. %
Cum. %
2
4
6
6
8
10
12
14
dw/dT
0
2
4
8
10
12
dw/dT
dw/dT
dw/dT
CRYSTAF
IPP + PE
CRYSTAF
EP+PE
Integral
Integral
Derivative
Derivative
Fig. 2.27 TREF and CRYSTAF analysis of PE–PP combinations showing the different fractionation capabilities (reprinted from [9] with permission of Springer Science + Business Media)
2.2 Crystallization Analysis Fractionation
49