

The differentiation of the integral CRYSTAF profile at each temperature provides
the amount of polymer crystallizing at each temperature. The CRYSTAF plot
presents the polymer crystallized as a function of temperature. It is the most widely
used and lucid representation of CRYSTAF results. Figure 2.26 depicts the integral
and differential profile for a blend of HDPE and PP. The molar mass of the polymer,
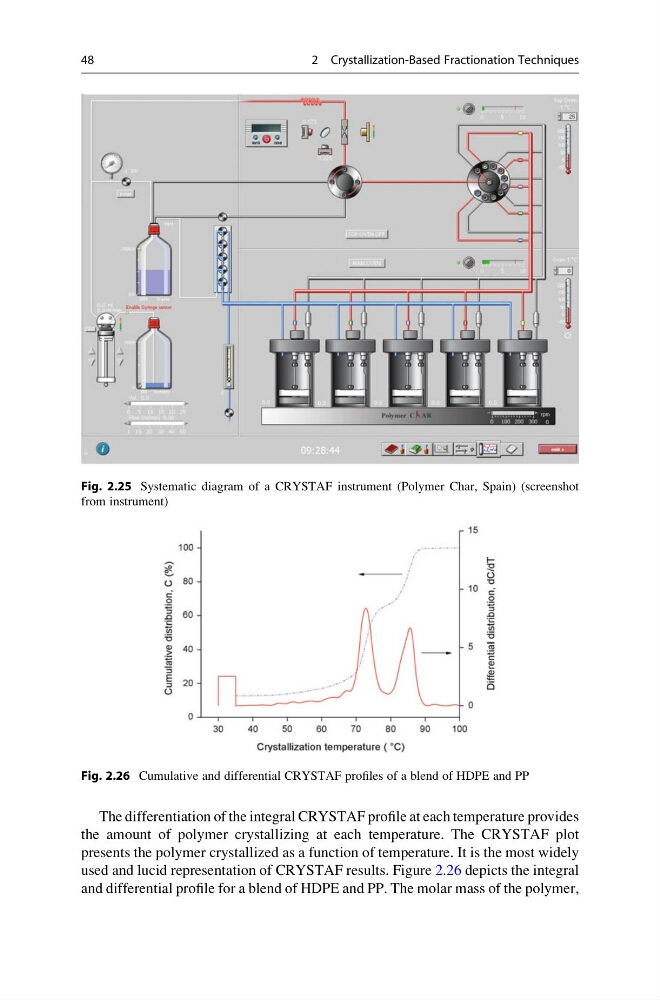
Fig. 2.25 Systematic diagram of a CRYSTAF instrument (Polymer Char, Spain) (screenshot
from instrument)
Fig. 2.26 Cumulative and differential CRYSTAF profiles of a blend of HDPE and PP
48
2 Crystallization-Based Fractionation Techniques
the amount of polymer crystallizing at each temperature. The CRYSTAF plot
presents the polymer crystallized as a function of temperature. It is the most widely
used and lucid representation of CRYSTAF results. Figure 2.26 depicts the integral
and differential profile for a blend of HDPE and PP. The molar mass of the polymer,
Fig. 2.25 Systematic diagram of a CRYSTAF instrument (Polymer Char, Spain) (screenshot
from instrument)
Fig. 2.26 Cumulative and differential CRYSTAF profiles of a blend of HDPE and PP
48
2 Crystallization-Based Fractionation Techniques