

The unique morphology of these copolymers plays a very important role in
governing the degradation, along with the effect of chemical composition.
The study was extended to thicker specimens where oxygen diffusion is expected
to play a greater role. FTIR microscopy and a conventional technique involving
layer-by-layer milling followed by SEC, FTIR and CRYSTAF analyses were used
to study the spatial heterogeneity within the copolymers 3V and 4V [99]. Details of
hyphenation of TREF-SEC-FTIR are discussed in [100].
1000
10000 100000 1000000
1000
10000 100000 1000000
1000
10000 100000 1000000
65h-30
90h-30
3V-0h-30
40h-30
Molar mass (g.mol
-1
)
65h-60
90h-60
3V-0h-60
40h-60
Molar mass (g.mol -1 )
3V-0h-80
40h-80
65h-80
90h-80
Molar mass (g.mol -1 )
1000
10000 100000 1000000
0.0
0.2
0.4
0.6
0.8
1.0
1.2
65h-90
90h-90
3V-0h-90
40h-90
Molar mass (g.mol
-1
)
1000 10000 100000 1000000
0.0
0.2
0.4
0.6
0.8
1.0
1.2
1000 10000 100000 1000000
1000 10000 100000 1000000
1000 10000 100000 1000000
1000 10000 100000 1000000
0.0
0.2
0.4
0.6
0.8
1.0
1.2
1000 10000 100000 1000000
1000 10000 100000 1000000
1000 10000 100000 1000000
Normalised detector signal
Molar mass (g.mol -1 )
4V-0h
4V-115h
179h-30
195h-30
4V-0h-30
115h-30
4V-179h
4V-195h
Molar mass (g.mol -1 )
179h-60
195h-60
4V-0h-60
115h-60
Molar mass (g.mol -1 )
179h-80
195h-80
4V-0h-80
115h-80
Molar mass (g.mol -1 )
179h-90
195h-90
4V-0h-90
115h-90
Normalised detector signal
Molar mass (g.mol -1 )
179h-100
195h-100
4V-0h-100
115h-100
Molar mass (g.mol -1 )
179h-110
195h-110
4V-0h-110
115h-110
Molar mass (g.mol -1 )
179h-120
195h-120
4V-0h-120
115h-120
Molar mass (g.mol -1 )
b
a
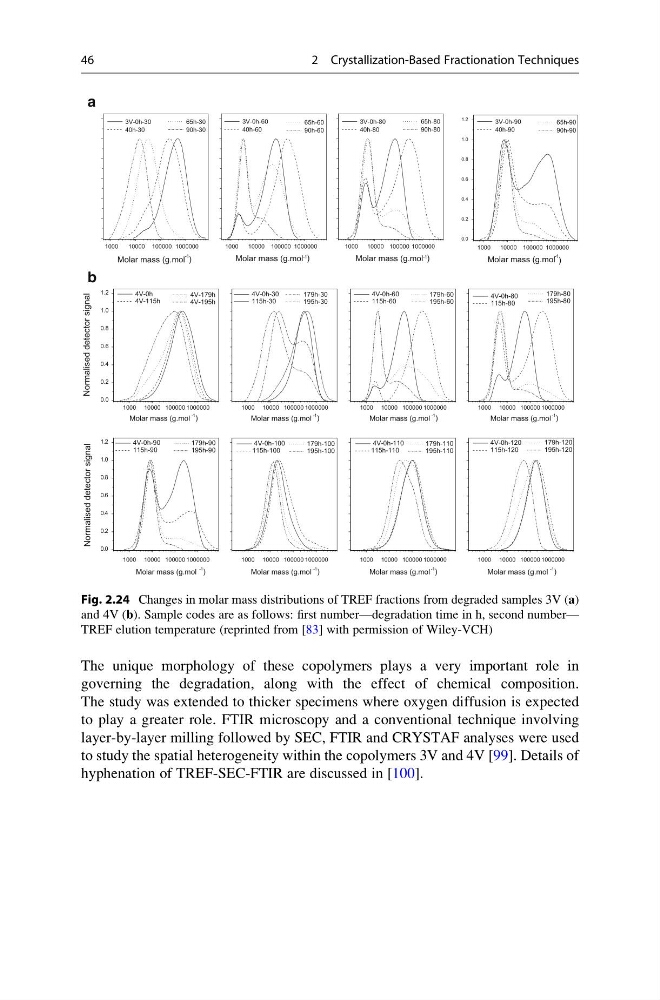
Fig. 2.24 Changes in molar mass distributions of TREF fractions from degraded samples 3V (a)
and 4V (b). Sample codes are as follows: first number—degradation time in h, second number—
TREF elution temperature (reprinted from [83] with permission of Wiley-VCH)
46
2 Crystallization-Based Fractionation Techniques
governing the degradation, along with the effect of chemical composition.
The study was extended to thicker specimens where oxygen diffusion is expected
to play a greater role. FTIR microscopy and a conventional technique involving
layer-by-layer milling followed by SEC, FTIR and CRYSTAF analyses were used
to study the spatial heterogeneity within the copolymers 3V and 4V [99]. Details of
hyphenation of TREF-SEC-FTIR are discussed in [100].
1000
10000 100000 1000000
1000
10000 100000 1000000
1000
10000 100000 1000000
65h-30
90h-30
3V-0h-30
40h-30
Molar mass (g.mol
-1
)
65h-60
90h-60
3V-0h-60
40h-60
Molar mass (g.mol -1 )
3V-0h-80
40h-80
65h-80
90h-80
Molar mass (g.mol -1 )
1000
10000 100000 1000000
0.0
0.2
0.4
0.6
0.8
1.0
1.2
65h-90
90h-90
3V-0h-90
40h-90
Molar mass (g.mol
-1
)
1000 10000 100000 1000000
0.0
0.2
0.4
0.6
0.8
1.0
1.2
1000 10000 100000 1000000
1000 10000 100000 1000000
1000 10000 100000 1000000
1000 10000 100000 1000000
0.0
0.2
0.4
0.6
0.8
1.0
1.2
1000 10000 100000 1000000
1000 10000 100000 1000000
1000 10000 100000 1000000
Normalised detector signal
Molar mass (g.mol -1 )
4V-0h
4V-115h
179h-30
195h-30
4V-0h-30
115h-30
4V-179h
4V-195h
Molar mass (g.mol -1 )
179h-60
195h-60
4V-0h-60
115h-60
Molar mass (g.mol -1 )
179h-80
195h-80
4V-0h-80
115h-80
Molar mass (g.mol -1 )
179h-90
195h-90
4V-0h-90
115h-90
Normalised detector signal
Molar mass (g.mol -1 )
179h-100
195h-100
4V-0h-100
115h-100
Molar mass (g.mol -1 )
179h-110
195h-110
4V-0h-110
115h-110
Molar mass (g.mol -1 )
179h-120
195h-120
4V-0h-120
115h-120
Molar mass (g.mol -1 )
b
a
Fig. 2.24 Changes in molar mass distributions of TREF fractions from degraded samples 3V (a)
and 4V (b). Sample codes are as follows: first number—degradation time in h, second number—
TREF elution temperature (reprinted from [83] with permission of Wiley-VCH)
46
2 Crystallization-Based Fractionation Techniques