

from the column. Accordingly, elution takes place with increasing temperature in
the direction of increasing crystallizability. The latest eluting fractions have the
highest crystallizability (lowest comonomer content, lowest degree of branching).
The elution process is monitored by standard concentration detectors such as
infrared (IR) and evaporative light scattering detectors (ELSD); however, more
detailed information can be obtained when additional molar mass sensitive
detectors, such as a viscometer (Visco) or light scattering (LS) detector, are used
[10–14].
Over the years, different (mainly home-built) instruments have been used; for
example see the schematic diagram in Fig. 2.2a [16] or instrument in [17]. Today,
the most common instrument is the fully automated TREF instrument produced by
Polymer Char, Valencia, Spain; see the schematic diagram in Fig. 2.2b.
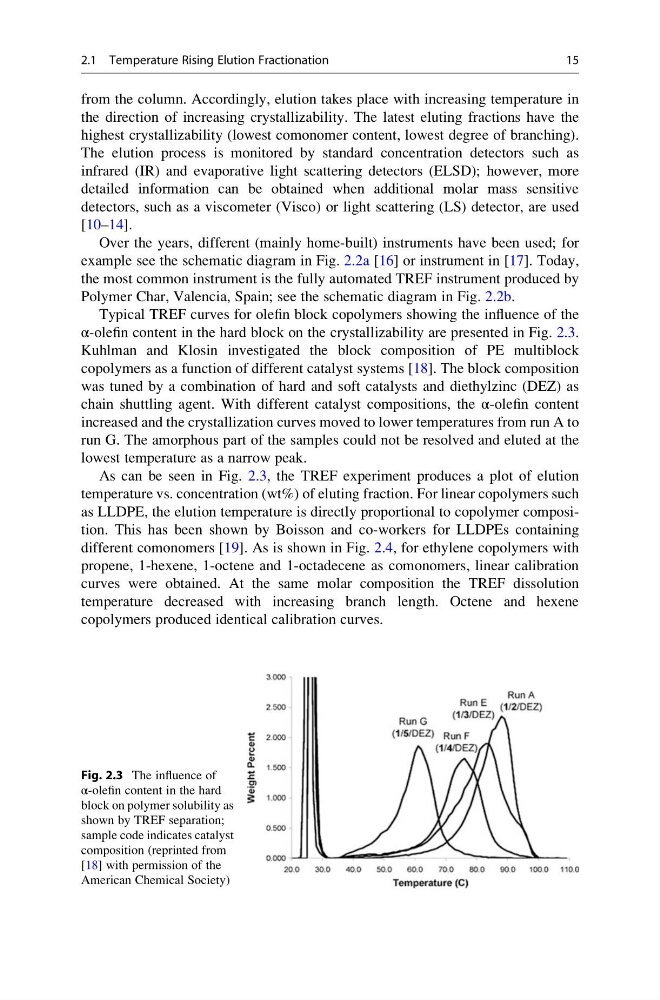
Typical TREF curves for olefin block copolymers showing the influence of the
α-olefin content in the hard block on the crystallizability are presented in Fig. 2.3.
Kuhlman and Klosin investigated the block composition of PE multiblock
copolymers as a function of different catalyst systems [18]. The block composition
was tuned by a combination of hard and soft catalysts and diethylzinc (DEZ) as
chain shuttling agent. With different catalyst compositions, the α-olefin content
increased and the crystallization curves moved to lower temperatures from run A to
run G. The amorphous part of the samples could not be resolved and eluted at the
lowest temperature as a narrow peak.
As can be seen in Fig. 2.3, the TREF experiment produces a plot of elution
temperature vs. concentration (wt%) of eluting fraction. For linear copolymers such
as LLDPE, the elution temperature is directly proportional to copolymer composition. This has been shown by Boisson and co-workers for LLDPEs containing
different comonomers [19]. As is shown in Fig. 2.4, for ethylene copolymers with
propene, 1-hexene, 1-octene and 1-octadecene as comonomers, linear calibration
curves were obtained. At the same molar composition the TREF dissolution
temperature decreased with increasing branch length. Octene and hexene
copolymers produced identical calibration curves.
Fig. 2.3 The influence of
α-olefin content in the hard
block on polymer solubility as
shown by TREF separation;
sample code indicates catalyst
composition (reprinted from
[18] with permission of the
American Chemical Society)
2.1 Temperature Rising Elution Fractionation
15
the direction of increasing crystallizability. The latest eluting fractions have the
highest crystallizability (lowest comonomer content, lowest degree of branching).
The elution process is monitored by standard concentration detectors such as
infrared (IR) and evaporative light scattering detectors (ELSD); however, more
detailed information can be obtained when additional molar mass sensitive
detectors, such as a viscometer (Visco) or light scattering (LS) detector, are used
[10–14].
Over the years, different (mainly home-built) instruments have been used; for
example see the schematic diagram in Fig. 2.2a [16] or instrument in [17]. Today,
the most common instrument is the fully automated TREF instrument produced by
Polymer Char, Valencia, Spain; see the schematic diagram in Fig. 2.2b.
Typical TREF curves for olefin block copolymers showing the influence of the
α-olefin content in the hard block on the crystallizability are presented in Fig. 2.3.
Kuhlman and Klosin investigated the block composition of PE multiblock
copolymers as a function of different catalyst systems [18]. The block composition
was tuned by a combination of hard and soft catalysts and diethylzinc (DEZ) as
chain shuttling agent. With different catalyst compositions, the α-olefin content
increased and the crystallization curves moved to lower temperatures from run A to
run G. The amorphous part of the samples could not be resolved and eluted at the
lowest temperature as a narrow peak.
As can be seen in Fig. 2.3, the TREF experiment produces a plot of elution
temperature vs. concentration (wt%) of eluting fraction. For linear copolymers such
as LLDPE, the elution temperature is directly proportional to copolymer composition. This has been shown by Boisson and co-workers for LLDPEs containing
different comonomers [19]. As is shown in Fig. 2.4, for ethylene copolymers with
propene, 1-hexene, 1-octene and 1-octadecene as comonomers, linear calibration
curves were obtained. At the same molar composition the TREF dissolution
temperature decreased with increasing branch length. Octene and hexene
copolymers produced identical calibration curves.
Fig. 2.3 The influence of
α-olefin content in the hard
block on polymer solubility as
shown by TREF separation;
sample code indicates catalyst
composition (reprinted from
[18] with permission of the
American Chemical Society)
2.1 Temperature Rising Elution Fractionation
15